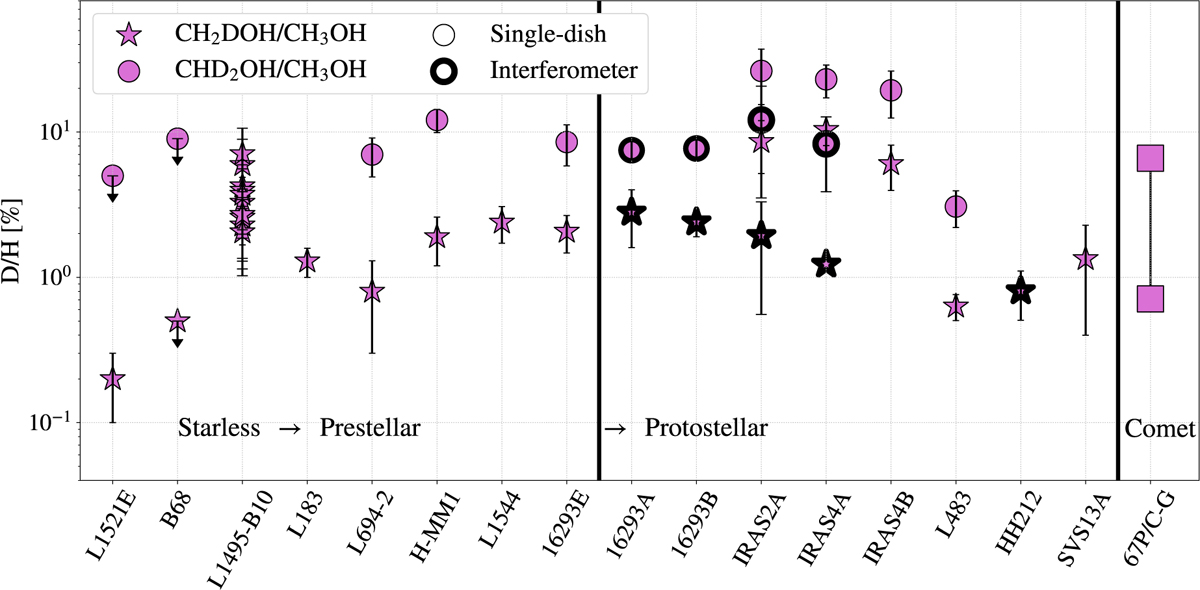
Fig. 7
Download original image
Statistically corrected D/H ratios for all starless and prestellar sources for which data are available (Chacón-Tanarro et al. 2019; Lattanzi et al. 2020; Ambrose et al. 2021; Lin et al. 2023), including IRAS 16293E presented in this work, as well as for a mix of single-dish and interferometric (thicker outlined markers) measurements toward protostars (Parise et al. 2006; Bianchi et al. 2017a,b; Agúndez et al. 2019; Taquet et al. 2019) and comet 67P/Churyumov-Gerasimenko (67P/C-G), which is shown instead as a range of values (Table 1 in Drozdovskaya et al. 2021) because these measurements are from the ROSINA mass spectrometer, and thus, the isotopologues are not uniquely identified and more uncertain than the spectroscopic data points. Upper limits are shown with downward arrows (see also Drozdovskaya et al. 2022 and Lin et al. 2023 for similar comparison plots).
Current usage metrics show cumulative count of Article Views (full-text article views including HTML views, PDF and ePub downloads, according to the available data) and Abstracts Views on Vision4Press platform.
Data correspond to usage on the plateform after 2015. The current usage metrics is available 48-96 hours after online publication and is updated daily on week days.
Initial download of the metrics may take a while.