Fig. B.1
Download original image
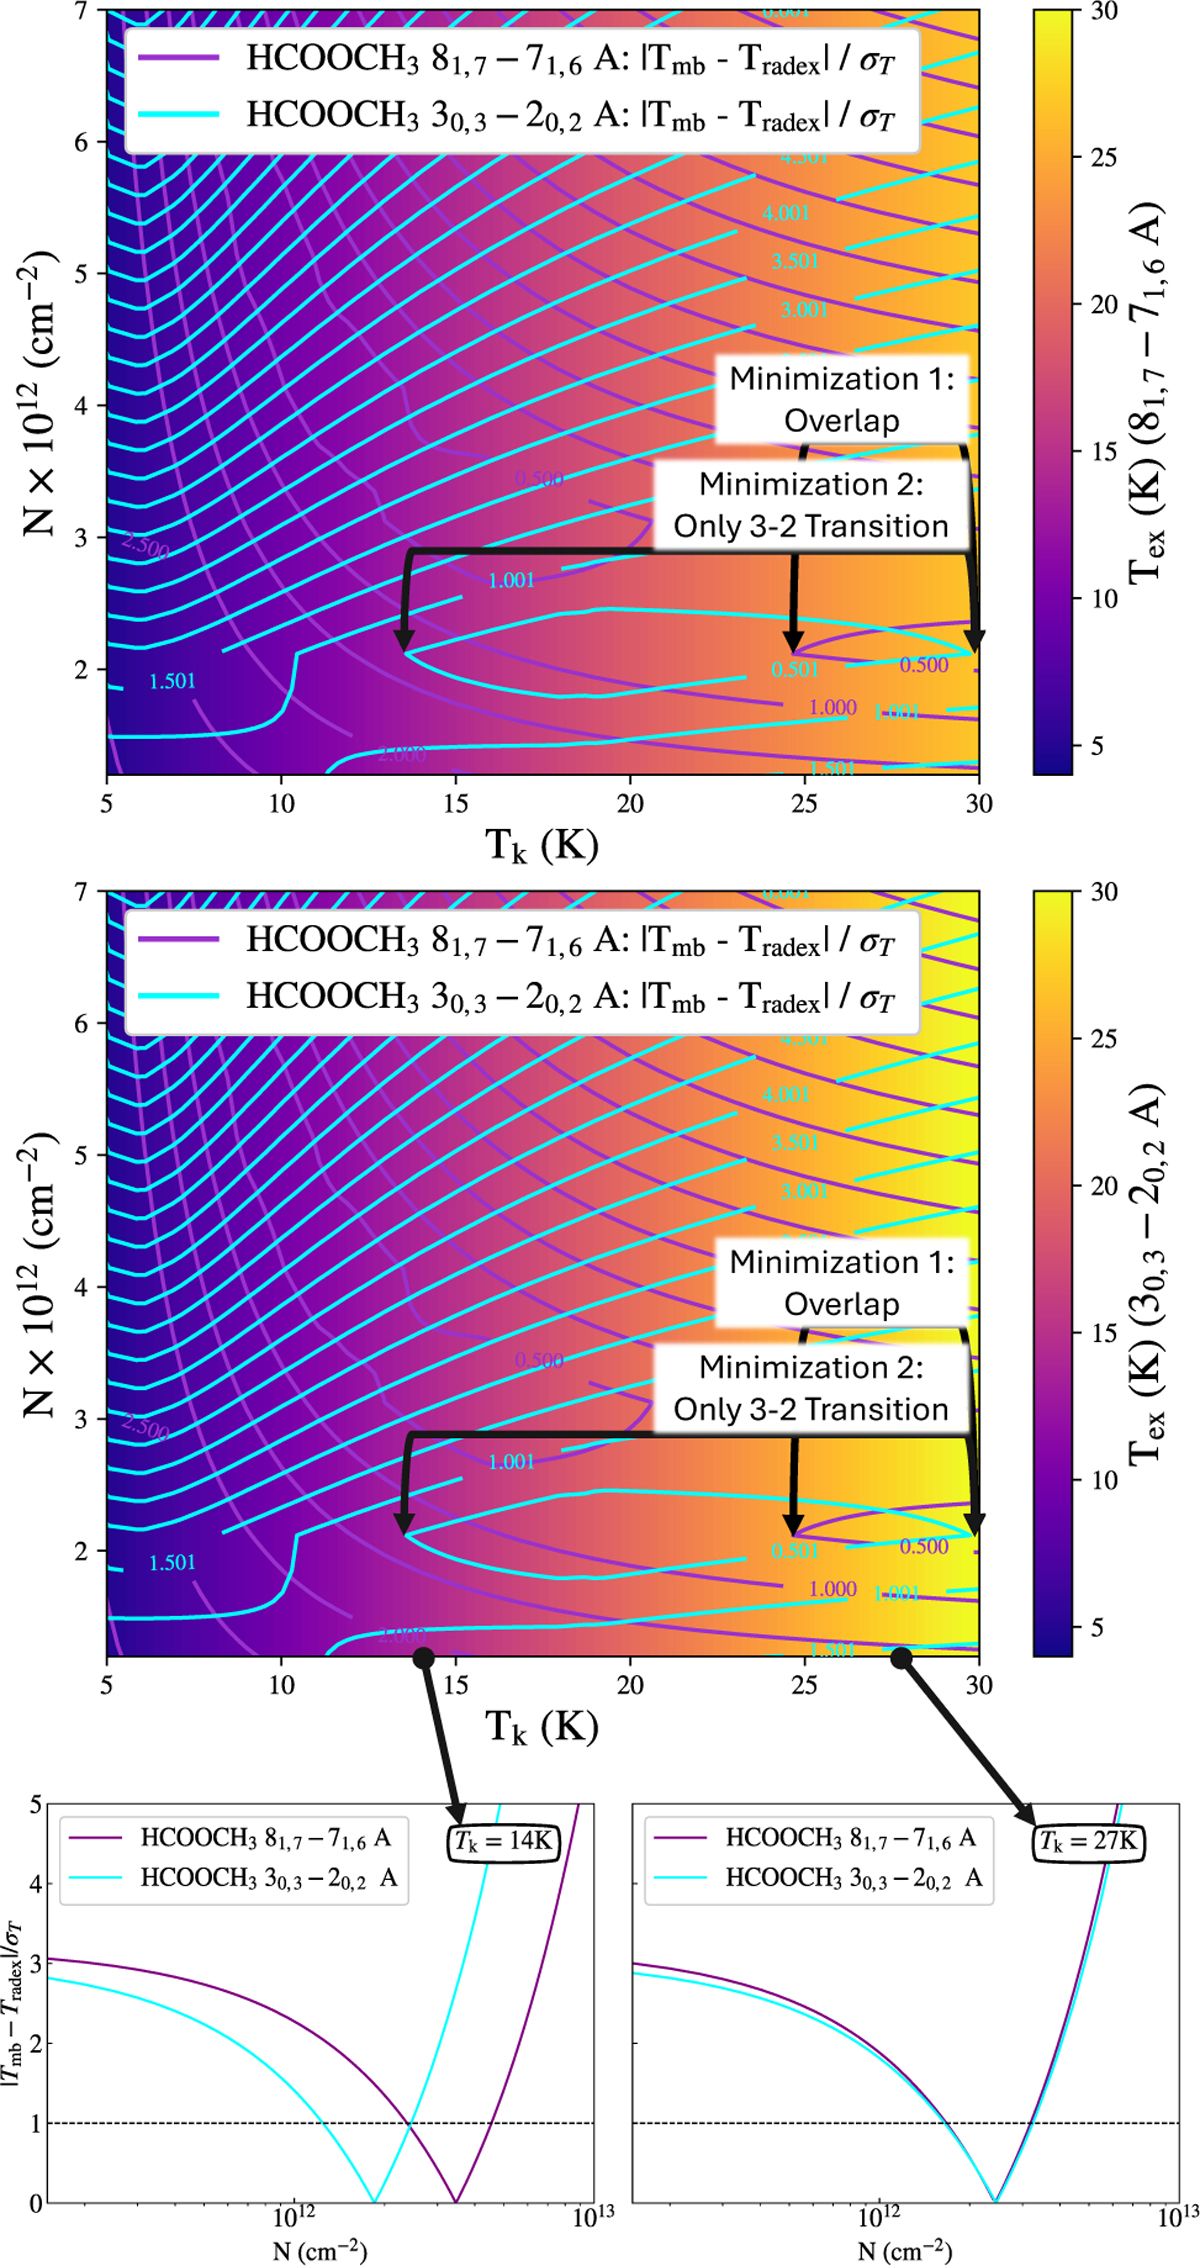
Grids of column density, N, versus kinetic temperature, Tk, for the case of HCOOCH3 A when excitation temperature, Tex, was calculated at each point for the 81,7 - 71,6 A transition (top) and the 30,3 - 20,2 A transition (middle). Overlaid on the grids are minimization contours for these two ‘A’ state transitions, where 81,7 - 71,6 A is in purple and 30,3 - 20,2 A is in cyan. The volume density is set to 7.72 × 105 cm−3 and 9.75 × 105 cm−3 for the 81,7 - 71,6 A and 30,3 - 20,2 A lines, respectively. In the case of ‘Minimization 1’, black arrows denote when the two modeled transitions are both best matched to the observations and overlap in N and Tk space. In the case of ‘Minimization 2’, black arrows denote where in parameter space we would expect to be if only the 30,3 - 20,2 transition was considered. Minimization curves at the bottom of the figure are also extracted at slices of the grid where Tk = 14 K, and Tk = 27 K to further illustrate how a best-fit was determined.
Current usage metrics show cumulative count of Article Views (full-text article views including HTML views, PDF and ePub downloads, according to the available data) and Abstracts Views on Vision4Press platform.
Data correspond to usage on the plateform after 2015. The current usage metrics is available 48-96 hours after online publication and is updated daily on week days.
Initial download of the metrics may take a while.