Fig. B.2
Download original image
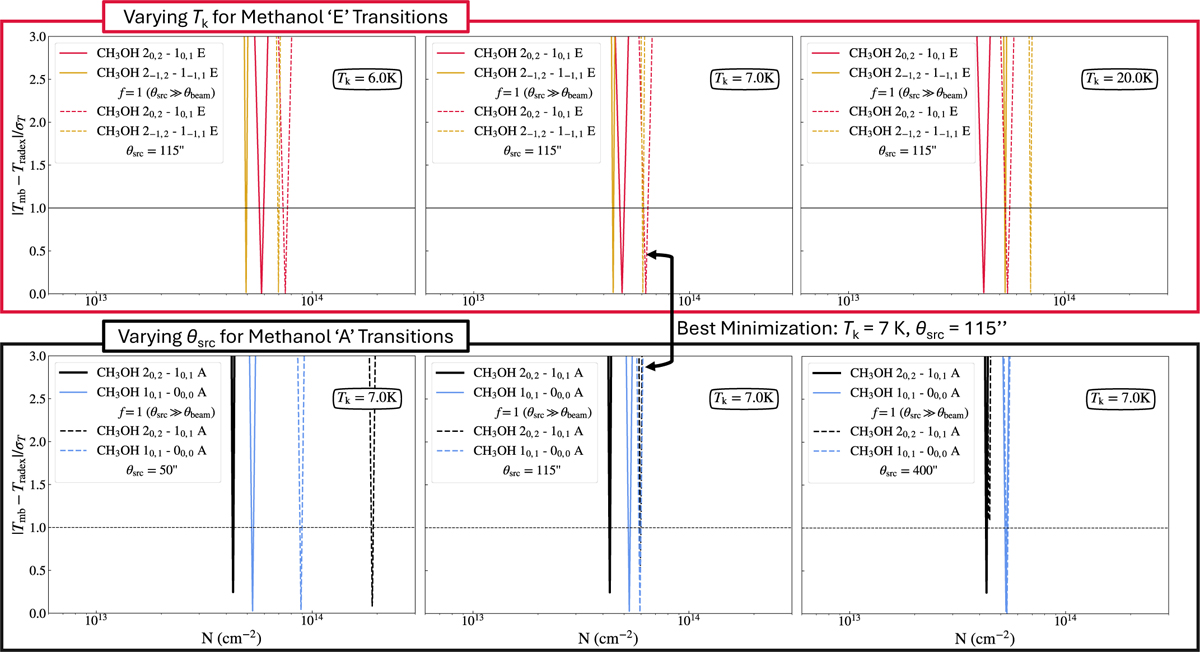
Representative RADEX CH3OH minimization plots for IRAS 16293E (see also Figure C1 in Scibelli et al. 2024). Plotted in each panel is the difference in the observed brightness temperature, Tmb, and the RADEX-calculated brightness temperature, Tradex, divided by the noise level, σT, versus the RADEX-calculated column density, N. When the RADEX model best fits the observations, |Tmb−Tradex|/σT was minimized and the best-fit N was found. In the top panels minimization curves are shown for the CH3OH E transitions from the ARO 12 m observations at different Tk values (in upper right corner of each plot). In the bottom panels minimization curves are shown for CH3OH A transitions, from both the ARO 12 m and Yebes 40 m observations, at a fixed Tk = 7 K and for varying θsrc values. In each plot the solid lines indicate when f – 1 was assumed and the dashed lines indicate that a specific θsrc has been used in the fit.
Current usage metrics show cumulative count of Article Views (full-text article views including HTML views, PDF and ePub downloads, according to the available data) and Abstracts Views on Vision4Press platform.
Data correspond to usage on the plateform after 2015. The current usage metrics is available 48-96 hours after online publication and is updated daily on week days.
Initial download of the metrics may take a while.