Open Access
Fig. C.1
Download original image
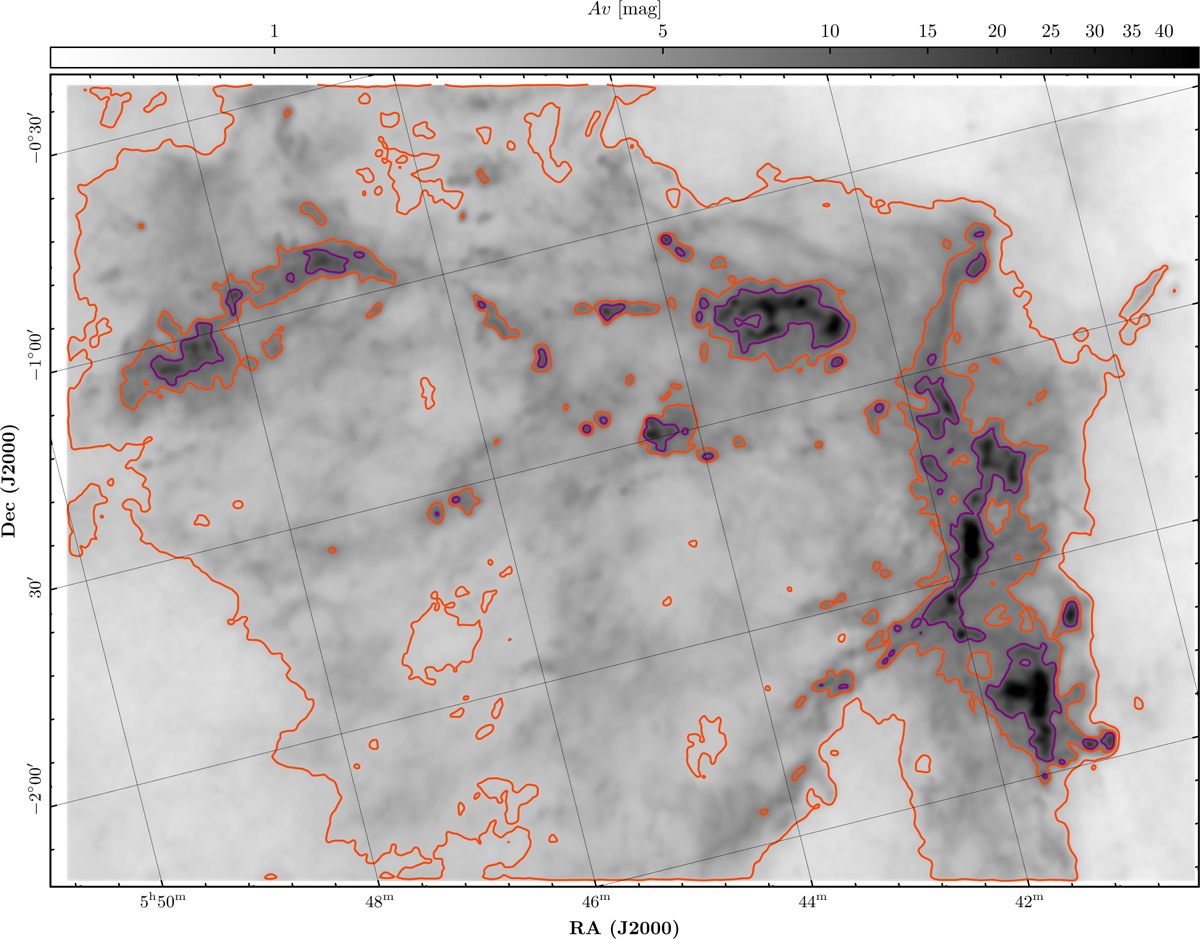
Dust visual extinction across Orion B. This map was derived from dust column density (Lombardi et al. 2014). Orange contours show regions of translucent gas, where Av is in the range from 2 mag to 6 mag. Purple contours show regions of dense gas.
Current usage metrics show cumulative count of Article Views (full-text article views including HTML views, PDF and ePub downloads, according to the available data) and Abstracts Views on Vision4Press platform.
Data correspond to usage on the plateform after 2015. The current usage metrics is available 48-96 hours after online publication and is updated daily on week days.
Initial download of the metrics may take a while.