Fig. D.1
Download original image
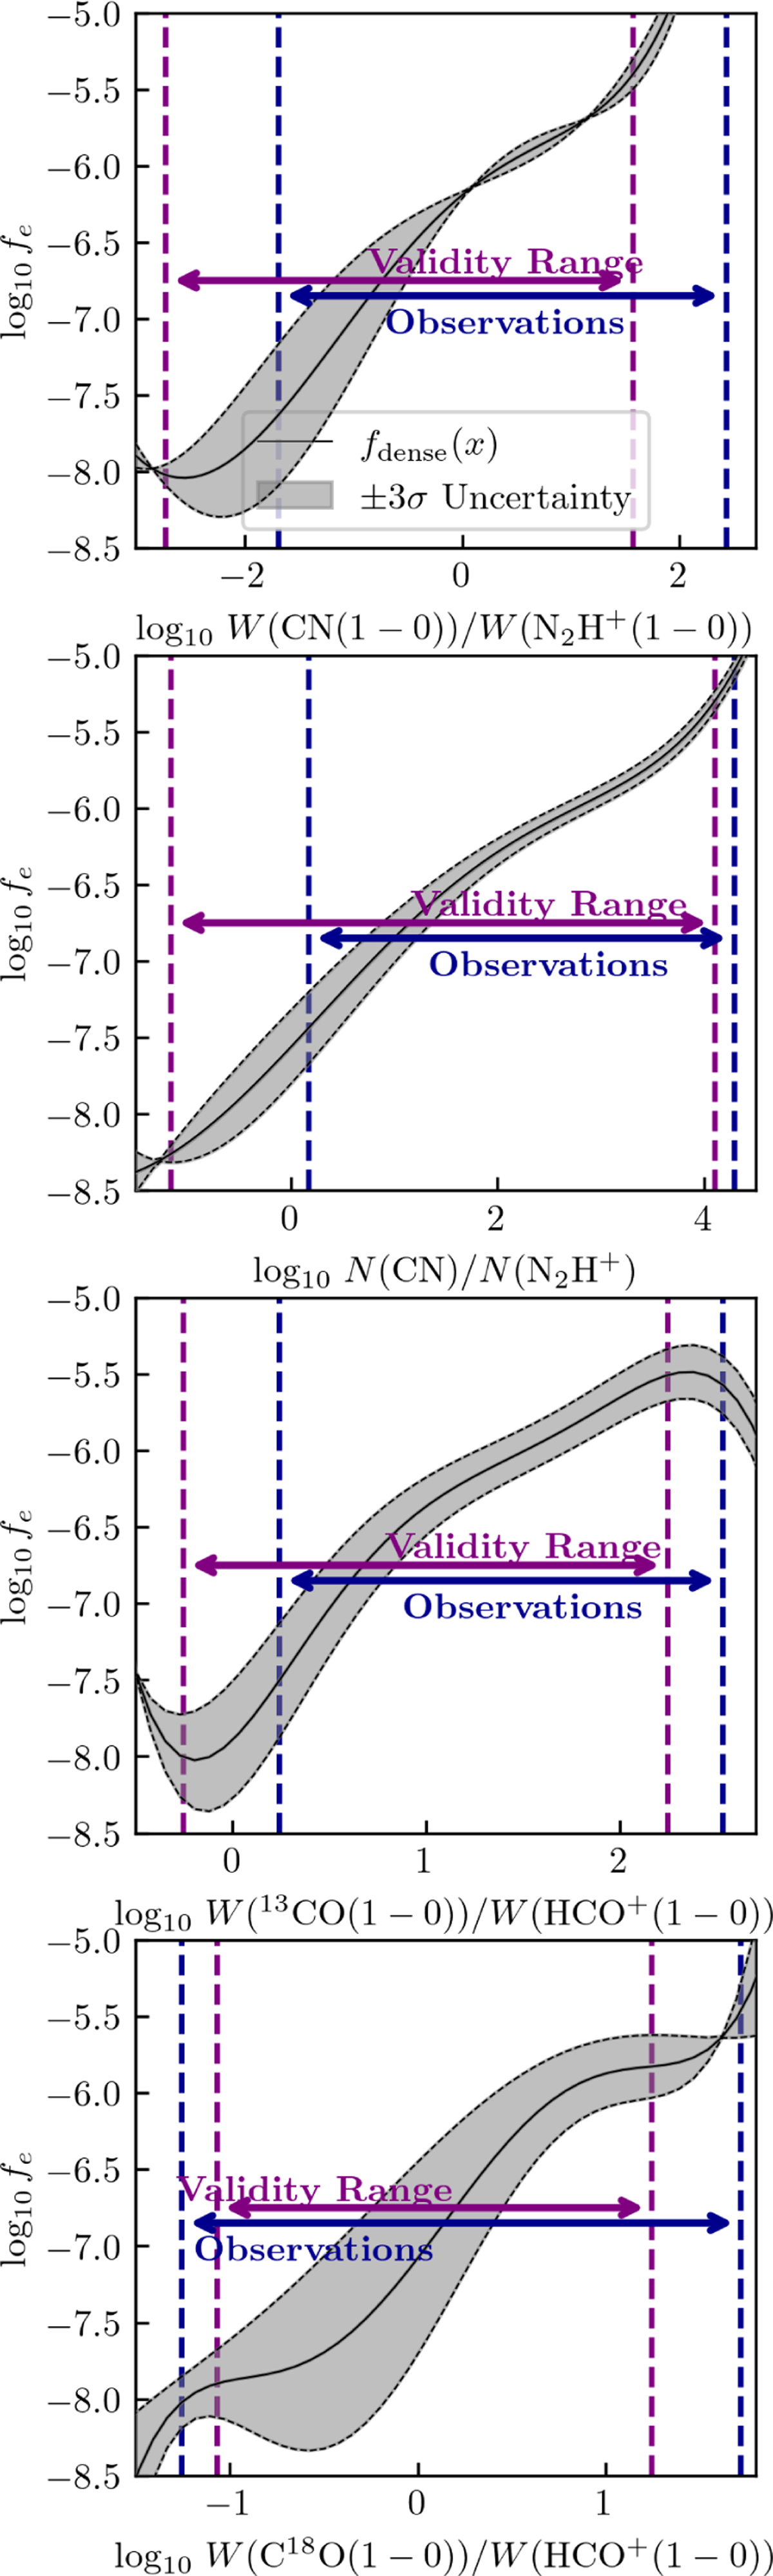
Ionization fraction as a function of selected line intensity ratios for dense gas. The range of observed line ratios is shown in blue and the validity range is in purple. We show the analytical function as a black solid line showing relation between fe (y-axis) and intensity ratios (x-axis) of CN/N2H+(top panel), N(CN)/N(N2H+)(second panel), 13CO/HCO+(third panel), and C18O/HCO+(bottom panel). The analytical functions (Eq. 2), its 3−σ variance (grey shaded area) and the validity ranges are taken from Bron et al. (2021).
Current usage metrics show cumulative count of Article Views (full-text article views including HTML views, PDF and ePub downloads, according to the available data) and Abstracts Views on Vision4Press platform.
Data correspond to usage on the plateform after 2015. The current usage metrics is available 48-96 hours after online publication and is updated daily on week days.
Initial download of the metrics may take a while.