Fig. 2
Download original image
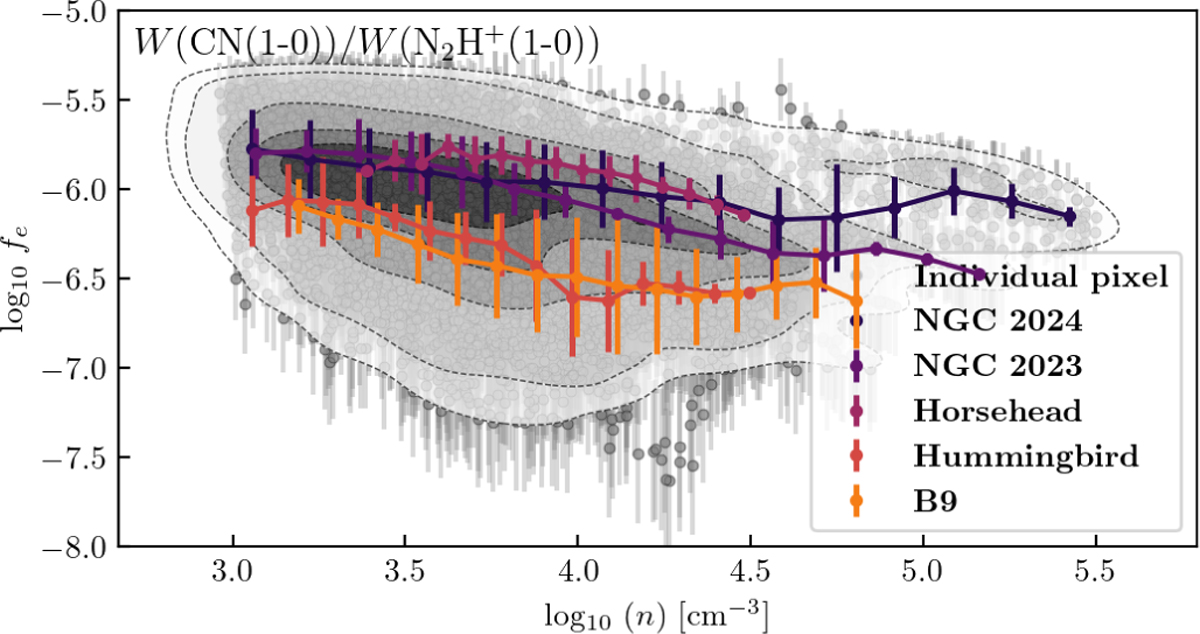
Ionization fraction computed using the W(CN)/W(N2H+)ratio as a function of volume-weighted mean volume density, n. Contours correspond to the density of points of 1, 5, 25, 50, and 75 percent (from the most outer to the most inner contour). Colored dots are the binned trends of pixels from the different regions in Orion B (top panel of Fig. 1). The error bars show the weighted standard deviation of the points within each bin.
Current usage metrics show cumulative count of Article Views (full-text article views including HTML views, PDF and ePub downloads, according to the available data) and Abstracts Views on Vision4Press platform.
Data correspond to usage on the plateform after 2015. The current usage metrics is available 48-96 hours after online publication and is updated daily on week days.
Initial download of the metrics may take a while.