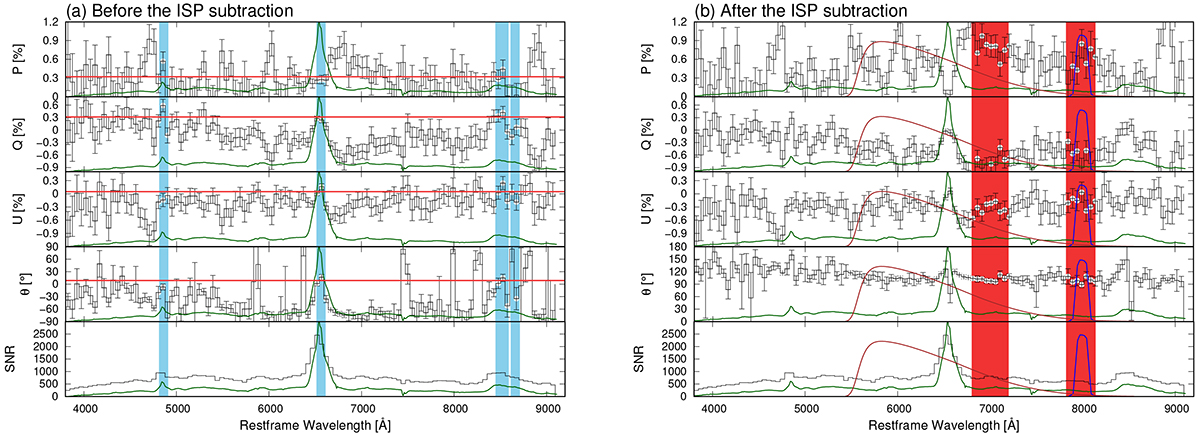
Fig. 1.
Download original image
Polarisation spectra of SN 2021irp before and after the ISP subtraction. (a) Total polarisation P, Stokes parameters Q and U, polarisation angle θ, and S/N before the ISP subtraction at a phase of 203.0 d (black lines). The data are binned to 50 Å per point. The grey lines in the background of each plot are the unbinned total-flux spectra at the same epoch. The ISP is described by PISP = 0.32 %, θISP = 8.8°(red lines). The blue hatching shows the adopted wavelength range for the ISP-dominated components. (b) Same as (a), but after the ISP subtraction. The brown and blue lines show the transmission curves of the R band and FILT_815_13. The red hatching shows the adopted wavelength range for the estimate of the continuum polarisation.
Current usage metrics show cumulative count of Article Views (full-text article views including HTML views, PDF and ePub downloads, according to the available data) and Abstracts Views on Vision4Press platform.
Data correspond to usage on the plateform after 2015. The current usage metrics is available 48-96 hours after online publication and is updated daily on week days.
Initial download of the metrics may take a while.