Fig. 1.
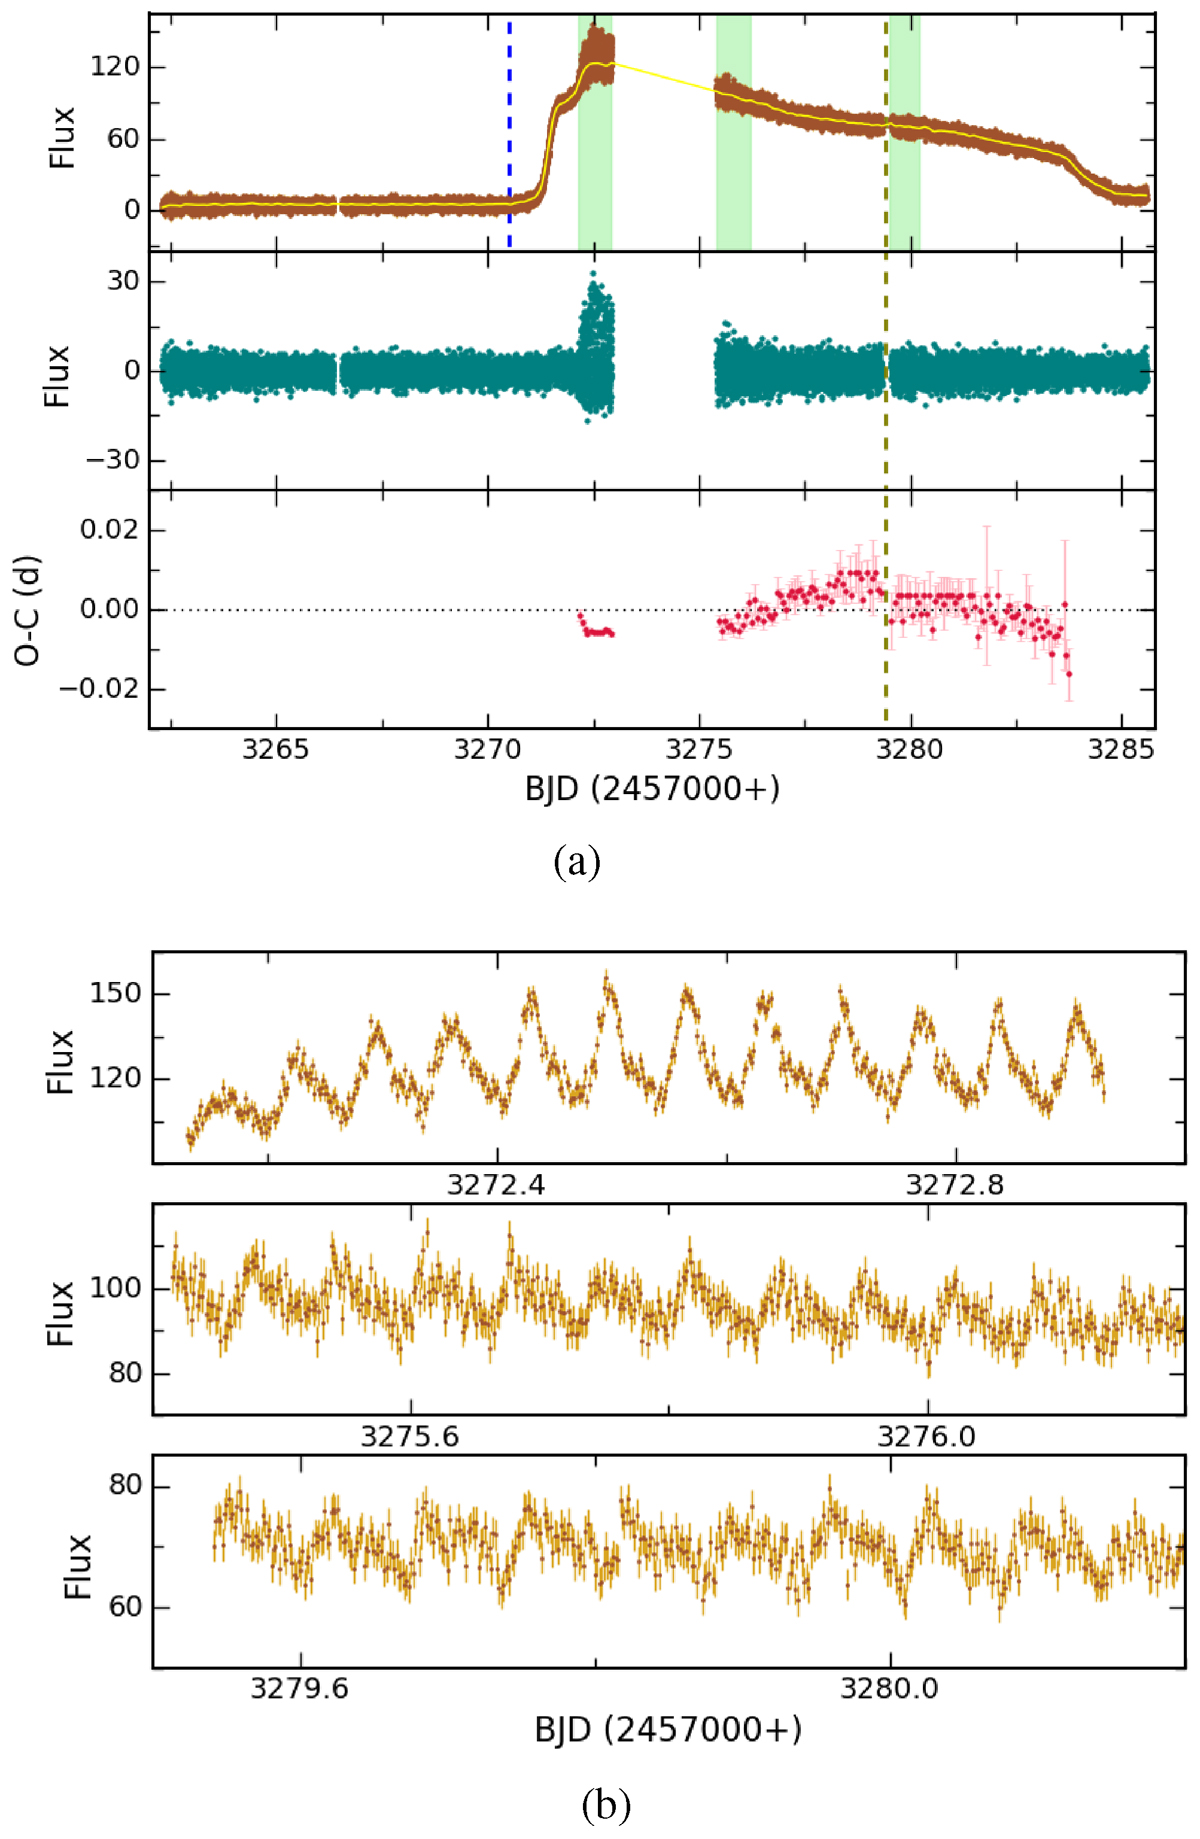
Download original image
(a) TESS light curve of J1100, displaying a super-outburst. A vertical blue dashed line at BJD 2460270.5020 represents a conservative estimate of the start time of the outburst. The solid yellow line represents the smoothed light curve obtained using the LOESS fit. Middle: Detrended light curves after subtracting the smoothed light curve. Bottom: O-C curves of superhumps. The light green vertical dashed lines represent a clear period transition in the O-C trends. (b) Zoomed-in segment of the TESS light curve over ∼0.7–0.8 d, corresponding to the shaded regions highlighted in the top panel of Figure 1a, shown for clarity.
Current usage metrics show cumulative count of Article Views (full-text article views including HTML views, PDF and ePub downloads, according to the available data) and Abstracts Views on Vision4Press platform.
Data correspond to usage on the plateform after 2015. The current usage metrics is available 48-96 hours after online publication and is updated daily on week days.
Initial download of the metrics may take a while.