| Issue |
A&A
Volume 702, October 2025
|
|
|---|---|---|
| Article Number | A70 | |
| Number of page(s) | 12 | |
| Section | Stellar structure and evolution | |
| DOI | https://doi.org/10.1051/0004-6361/202553810 | |
| Published online | 08 October 2025 | |
A tale of three cataclysmic variables with distinct superhumps
1
Institute of Astrophysics, Pontificia Universidad Católica de Chile, Av. Vicuña Mackenna 4860, 7820436 Macul, Santiago, Chile
2
Instituto de Física y Astronomía, Universidad de Valparaíso, Valparaíso, Chile
3
Millennium Institute of Astrophysics, Nuncio Monseñor Sótero Sanz 100, Providencia, Santiago, Chile
4
European Southern Observatory, Casilla, 19001 Santiago 19, Chile
5
Indian Institute of Astrophysics, Koramangala, Bangalore 560034, India
⋆ Corresponding author: This email address is being protected from spambots. You need JavaScript enabled to view it.
, This email address is being protected from spambots. You need JavaScript enabled to view it.
Received:
19
January
2025
Accepted:
18
August
2025
Abstract
Superhumps are among the most commonly observed variable features in the light curves of cataclysmic variables (CVs). To study the superhump behaviour of CVs, we present Transiting Exoplanet Survey Satellite (TESS) observations of three CVs: CRTS J110014.7+131552, SDSS J093537.46+161950.8, and [PK2008] HalphaJ130559. Among them, a super-outburst has been observed in CRTS J110014.7+131552, which is associated with the precursor outburst, where prominent superhumps have been observed during maximum of the outburst with a mean period of 0.06786(1) d. We observed variations in the superhump period, along with changes in the shape of the light curve profile and the amplitude of the superhumps during different phases of the outburst, indicating disc-radius variation as well as periodically variable dissipation at the accretion stream’s bright spot. The data on SDSS J093537.46+161950.8 reveal previously unknown variations modulated with periods of 0.06584(2) d and 2.36(2) d, related to the positive superhump and the disc-precession periods, respectively, which can reasonably be interpreted as a result of the prograde precession of an eccentric accretion disc. Despite its short orbital period, the lack of outburst activity, its stable long-term brightness, discovery spectrum, and absolute magnitude suggest that the object might not be an SU UMa type dwarf nova. Instead, it could belong to the group of high-mass-transfer CVs below the period gap: either a rare class of nova-like variables or a high-luminosity intermediate polar, a subclass of magnetic CVs. For [PK2008] HalphaJ130559, a new average orbital period of 0.15092(1) d has been identified. Additionally, this system displays previously undetected average periods of 0.14517(3) d and 3.83(1) d, which could be provisionally identified as negative superhump and disc-precession periods, respectively. If the identified simultaneous signals do indeed reflect negative superhump and disc-precession period variations, then their origin might be associated with the retrograde precession of a tilted disc and its interaction with the secondary stream.
Key words: binaries: close − novae / cataclysmic variables
© The Authors 2025
 Open Access article, published by EDP Sciences, under the terms of the Creative Commons Attribution License (https://creativecommons.org/licenses/by/4.0), which permits unrestricted use, distribution, and reproduction in any medium, provided the original work is properly cited.
This article is published in open access under the Subscribe to Open model. This email address is being protected from spambots. You need JavaScript enabled to view it. to support open access publication.
1. Introduction
Cataclysmic variables (CVs) are close interacting binaries consisting of a low-mass main sequence star transferring matter to the white dwarf (WD) via Roche lobe overflow (see Warner 1995, for an exhaustive overview). In non-magnetic or weakly magnetic systems, the accreting material forms an accretion disc around the WD due to conservation of the angular momentum, where viscous forces gradually drive it inward until it settles on the surface of the WD. Among non-magnetic CVs, nova-like variables form a subclass defined by their non-eruptive behavior, as they have never shown nova or dwarf nova outbursts. Their high mass-transfer rates create ionised accretion discs, which prevent the disc-instability mechanism responsible for outbursts (Osaki 1974). On the other hand, recurring outbursts on timescales from days to several years often occur in the thermally unstable accretion discs of dwarf novae, depending on the mass-transfer rate. Among dwarf novae, the subtype known as SU UMa lies below the period gap of 2–3 h and exhibits super-outbursts in addition to the normal outbursts. The thermal-tidal instability model (TTI), which integrates both thermal and tidal instabilities, is generally accepted as a valid explanation for superoutbursts and supercycle events (Osaki 1989, 1996). During superoutbursts, SU UMa systems exhibit superhumps, which reflect the beat period between the orbital period and the disc precession period (Vogt 1974; Osaki 1996; Wood et al. 2011). There are two types of superhumps: positive and negative ones, depending on whether the difference between the superhump and the orbital period is positive or negative, respectively. Positive superhumps are commonly found in the SU UMa-type systems. The period and amplitude of the positive superhumps fluctuate throughout the superoutburst (Kato et al. 2009). The theory of negative superhumps is less developed, and research suggests that they result from retrograde precession of the tilted disc nodal line (Bonnet-Bidaud et al. 1985; Harvey et al. 1995), but there is still no consensus on the cause of the tilted disc.
To effectively detect superoutbursts, superhumps, and their variations, long-span data are essential. Therefore, the continuous, long-baseline, high-cadence optical photometric data from the Transiting Exoplanet Survey Satellite (TESS; Ricker et al. 2015) provide an excellent resource for studying the detection and variation of superhumps. For the study presented in this paper, we selected a sample of three very interesting, but insufficiently studied candidates to carry out a detailed study of these phenomena. The available information on these sources is summarised below.
CRTS J110014.7+131552 (hereafter J1100) was identified as a CV based on the Sloan Digital Sky Survey (SDSS) spectrum (Szkody et al. 2006). Later, Kato et al. (2009) reported that superhumps were detected during the 2009 outburst observed by the Catalina Real Time Transient Survey (CRTS1; Drake et al. 2009). Using the short baseline of their observations, they determined a period of 0.067569 d.
SDSS J093537.46+161950.8 (hereafter J0935) was classified as CV by Szkody et al. (2009) using the SDSS spectrum. The strong He II (λ4686 Å) emission led Szkody et al. (2009) to propose that it may harbor a magnetic WD or possibly be an old nova. Southworth et al. (2015) reported photometric observations of J0935, revealing eclipses and allowing the determination of an orbital period corresponding to 0.0640591 d. They were unable to definitively classify or understand the nature of this system based on their findings. Later, Hardy et al. (2017) presented a single eclipse light curve at high time resolution using ULTRACAM on the William Herschel Telescope and suggested that its light curve resembles that of the polar HU Aqr.
[PK2008] HalphaJ130559 (hereafter J130559) was selected as a CV based on the detection of Hα emission (Pretorius & Knigge 2008). Their spectroscopic investigation also revealed the presence of a strong He II (λ4686 Å) emission line, together with broad Balmer and He I emission lines. Based on time-resolved spectroscopic observations, a period of 3.928 ± 0.013 h was determined and assumed to be the orbital period of the system. However, no photometric observations were conducted to further investigate this system.
Subsequent to these initial investigations, no further studies have been conducted on these systems. The inadequate examination of these sources prompted us to undertake a comprehensive investigation into their nature. Consequently, our current work focuses on studying these systems utilising extensive TESS observations. The paper is organised as follows. Section 2 contains observations and data reduction. The analyses and results are discussed in Sect. 3. Finally, the discussion and summary are presented in Sects. 4 and 5, respectively.
2. Observations and data reduction
A detailed log of the TESS observations for all three sources is given in Table 1. The cadence for all three sources was 2 min. The data of J1100, J0935, and J130559 are stored in the Mikulski Archive for Space Telescopes (MAST) data archive2. TESS consists of four cameras, each with a field of view of 24 × 24 degrees2, which are aligned to cover 24 × 96-degree2 strips of the sky called ‘sectors’ (see Ricker et al. 2015, for details). The TESS bandpass extends from 600 to 1000 nm, with an effective wavelength of 800 nm. Data taken during an anomalous event had quality flags greater than 0 in the FITS file data structure; thus we considered only the data with a ‘QUALITY flag’ = 0. Simple aperture photometry (SAP) fluxes were used for analyzing all three sources.
Log of the TESS observations of all three sources, J1100, J0935, and J130559.
3. Analysis and results
3.1. CRTS J110014.7+131552
The TESS light curve of J1100 is shown in the top panel of Figure 1a. Over roughly 25 days of TESS observations, the system initially remained in a quiescent state for approximately 8 d. This was followed by a prolonged outburst lasting about 14.5 d, after which the system appeared to return to a quiescent state. The brightness difference with respect to quiescence and, thus, the outburst amplitude, amounts to 4.5 mag. No other outbursts were visible during the TESS observation period. The amplitude, duration, and overall shape of the outburst indicate a super-outburst (see e.g. the light curve of V1504 Cyg in Osaki & Kato 2014), where the formation of positive superhumps is expected. In fact, Figure 1b shows zoomed-in versions of the shaded regions for specific time spans highlighted in top panel of Figure 1a during the outburst maximum and decline phases, where the evolution of the superhumps is evident. A significant change in the observed hump pattern and amplitude is visible in each light curve panel. Well-resolved prominent humps are evident at the peak of the outburst, persisting for approximately 19 h, after which they begin to decrease in amplitude and gradually disappear. A second hump also appears to be associated with this prominent hump, which is clearly visible in Figure 1b.
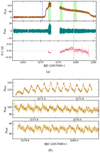 |
Fig. 1. (a) TESS light curve of J1100, displaying a super-outburst. A vertical blue dashed line at BJD 2460270.5020 represents a conservative estimate of the start time of the outburst. The solid yellow line represents the smoothed light curve obtained using the LOESS fit. Middle: Detrended light curves after subtracting the smoothed light curve. Bottom: O-C curves of superhumps. The light green vertical dashed lines represent a clear period transition in the O-C trends. (b) Zoomed-in segment of the TESS light curve over ∼0.7–0.8 d, corresponding to the shaded regions highlighted in the top panel of Figure 1a, shown for clarity. |
To identify the presence of periodicities in the system, the TESS data were first detrended to remove long-term variations, such as the outburst profile. We applied a locally weighted regression (LOESS; Cleveland 1979) with a smoothing span of 0.01 to smooth the light curves. This was then subtracted from the original light curve, resulting in the removal of the outburst variation (see middle panel of Figure 1a). We utilised the Lomb-Scargle (LS) periodogram (Lomb 1976; Scargle 1982) and Period04 (Lenz & Breger 2004) algorithms to analyse the detrended light curve in order to search for periodic signals. Two prominent peaks were observed at frequencies of ∼14.7 c/d and ∼29.5 c/d, corresponding to periods of 0.06786(1) d (∼1.629 h) and 0.033896(7) d (∼0.813 h), respectively, from the combined detrened light curve of the TESS data (see Figure 2). The uncertainties in these periods were determined by performing 100 iterations of Markov chain Monte Carlo (MCMC) simulations within the Period04 package. The significance of these detected peaks was determined by calculating the false-alarm probability (FAP; Horne & Baliunas 1986). Both detected periods were found to be significant and lie above the 95% confidence level, represented by the dashed horizontal green line. On the other hand, the corresponding analysis of only the quiescent portion of the data yielded a noise-dominated power spectrum without any significant peaks. The transient nature of the two frequencies detected in the bright data, as well as the shape of the modulation, unambiguously reveals that they are related to the superhump period. The strongest signal is seen at ∼0.0678 d in the outburst data, corresponding to the superhump period (PSH). The second strongest peak can be identified with the second harmonic (P2SH). The third and fourth harmonics (P3SH and P4SH) were also detected in the power spectra but are not significant, lying below the 95% confidence level. The superhump profiles, amplitudes, and periods vary significantly during the super-outburst phases. To investigate periodic variations in different phases of the outburst light curve, we determined the times of superhump maxima from BJD 2460272.165 to 2460283.743, using a quadratic polynomial fitting method. Later, we determined the cycle numbers of the observed superhump maxima by adopting an initial epoch and a period of ∼0.0678 d. Using these cycle numbers, we performed a linear fit against the observed times of maxima to obtain a refined initial epoch and period, given by
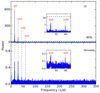 |
Fig. 2. LS and Period04 power spectra obtained from the combined detrended TESS light curve of J1100. The significant signals corresponding to the superhump frequency (SH) and its harmonics are distinctly marked. The significant frequencies observed in the power spectrum lie above the 95% confidence level, which is represented by the dashed horizontal green line. |
 (1)
(1)
Using this refined epoch and period, we calculated the expected (calculated) timings of maxima. The O-C values were then computed by comparing the observed maxima times with these calculated times, which is a typical method for studying periodic variations and trends in superhump signals. The O-C values are given in Table A.1 and plotted in the bottom panel of Figure 1a. The observed O-C trends provide clear evidence of superhump period variation after BJD 2460279.3. This expected period transition was also supported by periodogram analysis (not shown). The period was found to be shorter during the later phases of the outburst.
3.2. SDSS J093537.46+161950.8
Figure 3a presents the TESS observations of J0935, with the bottom subplot showing a zoomed-in view of the green-shaded region. Eclipse-like patterns are visible in the zoomed-in regions, although they do not appear very well-defined compared to the eclipses reported by Southworth et al. (2015). Periodogram analyses using LS and Period04 were performed on the combined TESS data, shown in the top and bottom panels of Figure 3b, respectively, revealing several prominent frequencies. We calculated the FAP to evaluate the significance of the peaks. The detected periods that are found to be significant and lie above the 95% confidence level are distinctly marked. Among those, the most prominent peak corresponds to 0.06406(1) d (∼1.536 h), reflecting the orbital (Ω) modulation (see Southworth et al. 2015). The corresponding harmonics up to 4 × Ω are also present.
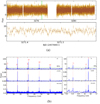 |
Fig. 3. (a) Top panel: Full TESS light curve of J0935. Bottom panel: Zoomed-in segment of the TESS light curve over ∼0.25 d, corresponding to the shaded region highlighted in the top panel, shown for clarity. (b) LS, CLEAN, and Period04 power spectra obtained from the combined TESS data. The significant signals are distinctly marked. A zoomed-in plot corresponding to the orbital (Ω), positive superhump (SH+), and prograde disc-precession ( |

Next to the orbital period, we find a peak at 0.06584(2) d (∼1.579 h), which is about 3% longer than the orbital one. Such value is typical for positive superhumps (PSH+). The observed orbital and superhump periods are close, which may raise the possibility of misinterpretation due to flickering or marginal aliases. However, the detection of its harmonic, P2SH+, strengthens the interpretation of the signal as the superhump period.
At the low-frequency end, there is another strong peak at 2.36(2) d. In superhump terminology, the positive superhump period is interpreted as the beat period between the orbital period and the precession period ( ) of an elliptical disc; namely,
  , where
  is the prograde disc-precession period when the disc precesses in the direction of the orbital motion (apsidal precession; Whitehurst 1988; Osaki 1989). Interpreting the 3% longer period as PSH+, we find
  d, which is in good agreement with the observed low-frequency strong peak. One small peak also lies slightly above the significance level near the
  frequency region, but no combinations with the observed frequencies seem to be found. The periods corresponding to the orbital, positive superhump, and disc-precession signals are listed in Table 2, with their associated errors estimated using the MCMC method, as for J1100. To assess the reliability of the detected weak signals, we further performed a CLEAN power spectral analysis (Roberts et al. 1987), which is shown in the middle panel of Figure 3b. This algorithm basically deconvolves window function from the dirty spectrum and produces a CLEAN spectrum, which is largely free of the many effects of spectral leakage. The CLEANed power spectrum was obtained with a loop gain of 0.1 and 1000 iterations. All the orbital and superhump frequencies, along with their harmonics, are found to be present in the CLEANed power spectrum of J0935. Additionally, all these detected CLEANed periods are found to be consistent with the periods derived from the LS and Period04 power spectral analyses. This indicates that the marked periods derived from the extensive TESS observations are real signals.
Periods corresponding to the dominant peaks in the power spectra of J1100, J0935, and J130559, determined using Period04.
To investigate the periodic phenomena, the light curve was folded using the zero-epoch provided by Southworth et al. (2015) and our derived orbital and superhump periods. Figure 4 shows the light curves folded at both the orbital and superhump frequencies. An eclipse feature is evident in the orbital-phased modulation, exhibiting symmetric ingress and egress profiles, along with a post-eclipse hump (see the bottom panel of Figure 4). On the other hand, the superhump modulation exhibits double-peaked modulation, with maxima occurring near phases 0.4 and 0.8, separated by a shallow minimum near phase 0.65 (see the upper panel of Figure 4). Evidence of a double-peaked pulse profile is also seen in the power spectrum, where a strong peak is observed at the superhump frequency as well as at its second harmonic.
 |
Fig. 4. Superhump and orbital phased light curves of J0935. |
3.3. [PK2008] HalphaJ130559
Figures 5a and 5b display the complete TESS light curves and the zoomed-in one-day light curves from the full observation period in sectors 64 and 65, respectively. The light curves from both sectors exhibit a clear eclipse profile, with each eclipse recurring approximately every 0.15 d, which thus should correspond to the orbital period of the system. To confirm this, the LS and Period04 periodogram algorithms were applied to the data from sectors 64 and 65, and the resulting power spectra, which show consistent peaks, are displayed in Figure 6. The power spectrum obtained for both sectors shows a dominant frequency corresponding to an average period of 0.15092(1) d (∼3.62 h), which is interpreted as the system’s orbital period. The associated uncertainties were estimated using MCMC simulations implemented in the Period04 package. Higher harmonics corresponding to this frequency are also evident in each of the power spectra. Another period close to the orbital frequency is observed at an average period of 0.14517(3) d (∼3.48 h), which differs from the orbital period by approximately 4%. This could be associated with a negative superhump period (PSH−). A significant peak corresponding to the period of ∼0.07398 d was also observed near the 2Ω frequency in both sectors. However, this deviates slightly from its expected second harmonic period (P2SH−) of ∼0.07259 d. These detected periods are found to be significant and lie above the 95% confidence level. Consistent with the LS and Period04 results, the CLEAN algorithm also detected all significant peaks in the power spectra of both sectors (see middle panels of Figure 6). The negative superhump period (PSH−) is interpreted as  , where
  is the retrograde disc-precession period when the disc precesses in the opposite direction of the orbital motion or the node line precession (Patterson et al. 1997). Using this expression and the derived orbital and candidate negative superhump periods, we calculated the disc-precession periods to be approximately 3.82 d for sector 64 and 3.80 d for sector 65. In the power spectra of both sectors, we observed peaks at periods of 3.93(1) d and 3.73(1) d in the low-frequency region for sectors 64 and 65, respectively (see Figure 6). An average value 3.83 d of these observed periods closely matches the expected values for sectors 64 and 65, although the individual sectors do not show this period precisely. Considering the available evidence, the identification of the negative superhump and disc-precession periods remains provisional and subject to further confirmation.
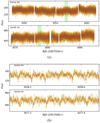 |
Fig. 5. (a) Full TESS light curves of J130559 for sectors 64 and 65. (b) Zoomed-in segment of the TESS light curve over ∼1 d, corresponding to the shaded regions highlighted in Figure 5a, shown for clarity. |
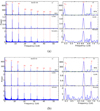 |
Fig. 6. LS, CLEAN, and Period04 power spectra of J130559 obtained from the TESS data for (a) sector 64 and (b) sector 65. The significant signals are distinctly marked. A zoomed-in plot corresponding to the orbital (Ω), negative superhump (SH−), and retrograde disc-precession ( |

Following the same approach described for J1100 and J0935, we inspected the phased-light curve variations for J130559 using a random zero-epoch as BJD 2460042.0913 and our derived orbital and likely superhump periods (as shown in Figures 7a and 7b for sectors 64 and 65, respectively). A prominent eclipse feature is evident in the orbital phased-light curves of both sectors, which is associated with the post-eclipse hump. No noticeable hump is present in the phases before the primary eclipse. Apart from the primary eclipse, a secondary eclipse-like feature appears around phase 0.5. However, this feature seems to vanish in sector 65. The superhump-phased light curve displays a notable evolution between sectors 64 and 65. In sector 64, the superhump-phased light curve exhibits a dominant hump feature with a pronounced peak centered at phase 0.5. However, in sector 65, this peak undergoes a transformation, splitting into two separate peaks at phases 0.45 and 0.65, with a shallow dip appearing near phase 0.56. Finally, we note that a broad minimum is observed around phase 0.0 in the superhump-phased light curve.
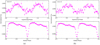 |
Fig. 7. Superhump-and-orbital phase folded light curves of J130559 for (a) sector 64 and (b) sector 65. |
4. Discussion
4.1. J1100
TESS observations of J1100 reveal a prolonged outburst lasting 14.5 d following 8 d of quiescence, after which the system returns to a quiescent state. A precursor outburst was detected alongside the main outbursts. Prominent superhumps emerged at the peak of the main outburst and took approximately one day to reach their maximum amplitude. As the outburst fades, the superhump amplitude progressively decreases and eventually disappears. This light curve feature is a typical characteristic of super-outbursts in SU UMa-type stars.
A photometric period of 0.06786(1) d was detected from the combined TESS observations, which lies below the period gap and may correspond to the superhump period. This period is found to vary, becoming shorter during the later phases as the brightness decreases. The change in the superhump period can be attributed to variations in the disc radius throughout the super-outburst phases, supporting the thermal-tidal instability model for the super-outburst of SU UMa stars. The superhump period is typically longer during the early phases of a super-outburst due to the expansion of the accretion disc, which reaches or exceeds the 3:1 resonance radius. At this stage, the disc becomes more eccentric and the stronger tidal forces exerted by the secondary star cause the disc to precess more slowly, resulting in a longer superhump period. However, as the outburst progresses, the accretion disc gradually shrinks in size, which weakens the tidal interaction, allowing the disc to precess more quickly; this leads to a shorter superhump period in the later phases (Kato et al. 2009; Osaki & Kato 2013). Additionally, the shape and amplitude of the light curve profile vary throughout the various phases of the outburst. During the early phase, the superhump modulation exhibits a sharply peaked pulse shape, which may arise from viscous dissipation in the periodically deforming disc. In the later phases, a second peak-like structure emerges, although it is not particularly prominent (see Figure 1b). If this feature indeed represents a secondary superhump maximum, it might be attributed to periodically variable dissipation at the accretion stream bright spot (see Wood et al. 2011).
4.2. J0935
From the TESS observations, we have detected an orbital period of 0.06406(1) d, with eclipsing features occurring periodically during its orbit, which is consistent with the orbital period determined by Southworth et al. (2015). A post-eclipse hump in orbital modulation is also observed, similar to that reported by Southworth et al. (2015). In many short-period CVs, a distinct orbital hump appears just before the eclipse, generally produced by the hot spot at the edge of the accretion disc rotating into view. On the other hand, the post-eclipse hump suggests the existence of a period different from the orbital period, known as the superhump period. Although only the orbital period was identified, no additional periods were observed in the results of Southworth et al. (2015), likely due to inadequate data coverage. In the present TESS observations, we found a significant peak at 0.06584(2) d, which is 3% longer than the orbital period. This can be interpreted as a so-called common or positive superhump; the latter term referring to the positive period excess (i.e. the superhump period being longer than the orbital period), which likely arises from the prograde apsidal precession of an eccentric accretion disc. The observed disc-precession period of approximately 2.36 d is consistent with the interpretation of a positive superhump and supports the presence of a precessing eccentric disc in J0935. The superhump-phased light curve of J0935 shows a double-peaked structure separated by a shallow minimum. In past studies, most sources were found to exhibit normal pronounced bump-shaped superhump-phased light curves (see Patterson et al. 2005; Bruch 2023a,b, 2024). Interestingly, some exceptions to these features have been found, as noted in the works of Schmidtobreick et al. (2008) and Bruch (2023a, b, 2024), which identified peculiar sources with superhump light curves characterised by two or more peaks and sharply defined minima and maxima. The fractional excess of the superhump period over the orbital period is expressed as
 (2)
(2)
which is calculated to be approximately 0.028. The superhump excess has been shown to be correlated with the mass ratio of the binary system components by Patterson et al. (2005) with the relation
 (3)
(3)
although Kato (2022) has suggested that this relation may suffer from the difficulty of not considering pressure effects within the accretion disc. The lack of outburst staging in J0935 prevents the application of stage-specific calibrations from Kato (2022), and thus we rely on Patterson et al. (2005) with caution. Taken at face value, Equation (3) yields an estimate of q approximately 0.128. Using this value and assuming the expected secondary mass corresponding to the orbital period of approximately 0.09 M⊙ (Knigge et al. 2011), the mass of WD is estimated to be ∼0.7 M⊙ for J0935.
For J0935, we observe a short orbital period, a positive superhump period, a disc precession period, and its superhump period excess aligns with the Patterson & Warner (1998) diagram. However, it has nonetheless remained in a constant average brightness state and it has not exhibited any outburst activity during long-term observations, as discussed in the following paragraph. In a few SU UMa-type systems, such as V1159 Ori, ER UMa, WZ Sge, EG Cnc, and V344 Lyr (Patterson et al. 1995, 1998; Gao et al. 1999; Still et al. 2010), superhumps have also been detected outside the super-outburst intervals. Hellier (2001) suggested that systems with q ≤ 0.07 can exhibit quiescent and normal outburst superhumps due to efficient angular momentum transfer by tidal dissipation in this regime, permitting both cooling and heating fronts to propagate, even when the outer edge of the accretion disc extends beyond the 3:1 resonance radius. Moreover, the theoretical limit for the condition required to generate superhumps (or for the disc to reach the 3:1 resonance in dwarf novae) lies within the mass ratio range of q = 0.22 − 0.39 (Whitehurst & King 1991; Pearson 2006; Smak 2020). The estimated mass ratio q of 0.128 for J0935 does not meet either of the criteria required for superhumps. However, it is comparable to that of other superhumpers, such as V1159 Ori and ER UMa, where superhumps have been observed during quiescence or normal outbursts (Patterson et al. 1995; Gao et al. 1999), with a mass ratio of approximately 0.14. The distribution of mass ratio versus orbital period for known short-period CVs including ER UMa, V1159 Ori, and J0935 is shown in Figure 8. The dashed blue line represents the standard CV evolutionary track from Knigge et al. (2011), while the solid red line illustrates their revised (optimal) binary track. The calculated mass ratio of J0935 falls within the predicted evolutionary track, implying that J0935 is following the typical evolutionary path for CVs. This system is currently in the middle stage of its evolution and is slowly transitioning toward a shorter orbital period. This process is expected to take a considerable amount of time before reaching its period minimum. Positive superhumps for CVs below the period gap are typically a short-term phenomenon intimately connected to super-outbursts. Within the TTI model, the deformation of the disc actually helps to deplete the disc (it enhances the mass transfer through the disc). Thus, in the case of J0935, to maintain that state and the positive superhumps, the donor star would have to retain a high mass-transfer rate to the disc.
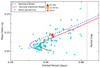 |
Fig. 8. Distribution of mass ratio versus orbital period for known short-period CVs. The dashed blue line shows the standard CV evolutionary track from Knigge et al. (2011), while the solid red line represents their optimal binary track. The green points represent the mass ratio and period reported in the literature (Kato 2022). V1159 Ori and ER UMa are represented by an orange square and a brown triangle, respectively, while J0935 (our work) is shown as a magenta star. |
The discovery spectrum of J0935 features a prominent blue continuum and broad but weak Balmer emission lines, providing initial evidence that the system may be a nova-like variable with a high accretion rate (Szkody et al. 2009). Along with the TESS, we also examined its long-term behavior in Zwicky Transient Facility (ZTF; Bellm et al. 2019; Graham et al. 2019; Dekany et al. 2020), Catalina Real-Time Transient Survey (CRTS; Drake et al. 2009), American Association of Variable Star Observers (AAVSO; Kafka 2021), and Global Astrometric Interferometer for Astrophysics (Gaia; Gaia Collaboration 2016, 2023) data, and did not find any evidence of outbursts. Some brightening measurements appear in a few epochs of the Gaia observations, but we suspect them to be spurious, as all G, BP, and RP magnitudes for those epochs were taken at the same time, yet their values are not aligned. Moreover, no such event was observed in the CRTS, even at or very close to the epochs of Gaia brightening. In addition, AAVSO data (although very incomplete) provides coverage of the object from May 2012 onward, with the only positive detections finding the object between V = 19.8 mag and 19.1 mag, while Szkody et al. (2009) reported g = 19.10 mag and u − g = 0.42 mag. The light curve from Southworth et al. (2015) shows the system at B = 19.2 − 18.6 mag out of eclipse, which, considering above positive blue colour index, lies within the same regime as the other brightness values. In summary, all measurements show the system at a visual brightness slightly fainter than 19 mag. While an absence of evidence does not signify evidence of absence, there is no observational indication that the object has ever been in outburst. Therefore, it appears reasonable to assume that J0935 contains a stable accretion disc with the only significant brightness variations being related to orbital modulations such as eclipses, the orbital hump, and superhumps.
Adopting the Gaia DR3 distance of  pc from Bailer-Jones et al. (2021) and Gaia magnitude of 18.73, we estimated an absolute magnitude of
  and a colour of 0.28(06) mag for J0935. These values place J0935 in a sparsely populated region of the colour–magnitude diagram presented by Abril et al. (2020, their Fig. 2), lying somewhat between the main bulks of all the CV subtypes, which makes it difficult to assign J0935 to any of them, based on the photometric characteristic. Its location on the diagram implies a mass-transfer rate that is neither particularly high (as for nova-likes), nor particularly low (as for dwarf novae below the period gap). Additionally, a comparison with the absolute magnitude versus orbital period plot in Mukai & Pretorius (2023), which is mainly applicable to intermediate polars (IPs), but also includes curves for dwarf novae in quiescence and outburst, is similarly inconclusive, as J0935 again lies between the two distributions. However, since J0935 is eclipsing, its high inclination will affect the absolute magnitude, causing it to appear about 3–4 mag fainter than it would at an average inclination (see Warner 1987; Selvelli & Gilmozzi 2019). Accounting for this inclination effect places J0935 in the nova-likes/old novae/IPs regime in Abril et al. (2020), and in the high mass-transfer (high-luminosity IPs and dwarf novae in outburst) zones in Mukai & Pretorius (2023).
As the SDSS spectrum of J0935 reveals strong He II (λ4686 Å) emission, it may indicate that it belongs to the IP class of magnetic CVs. Interestingly, some IPs have been observed to show positive superhumps (see Mukai & Pretorius 2023). However, high mass-transfer nova-likes have also been found to exhibit comparatively strong He II emission (e.g. Schmidtobreick 2015); hence, it does not appear to be an unambiguous indicator for a magnetic WD. Furthermore, the vast majority of IPs with orbital periods close to that of J0935 have a significantly lower intrinsic brightness, although we note that in the case of IGR J18173-2509, there is one example of a high-luminosity IP located below the period gap (Mukai & Pretorius 2023). Since this source has not been observed in X-rays so far, we do not know whether or not there are X-ray spin or sideband modulations that are typically used to confirm the IP nature of a system. Future X-ray observations may help determine whether such modulations are present and thereby confirm (or rule out) its classification as an IP.
The accumulated evidence suggests that J0935 is not an SU UMa-type dwarf nova, but instead it might represent a rare type of high mass-transfer CV below the period gap, which makes it a particularly intriguing object. Based on the estimated mass ratio and orbital period, the system falls within the typical evolutionary track (see Figure 8). According to the standard theory of CV evolution, systems below the period gap are expected to have low mass-transfer rates and to exhibit dwarf nova outbursts. However, the unusually high mass-transfer rate suspected for this system deviates from these expectations, challenging the traditional understanding of CV evolution as provided by conventional models. The high mass-transfer rate in this short-period CV may be attributed to nova eruptions, as discussed by Patterson et al. (2013) in their study of BK Lyn. Subsequently, Hillman et al. (2020) extensively discussed the effect of nova eruptions on the mass-transfer rate in the context of short- and long period CVs. As a result of these eruptions, the mass-transfer rate could remain high for extended periods. Over time, it might transform into a dwarf nova star, once the accretion rate has dropped sufficiently to trigger dwarf nova eruptions.
4.3. J130559
The orbital modulation of J130559 exhibits an eclipse feature characterised by asymmetric ingress and egress profiles, along with a noticeable post-eclipse hump. A photometric period of 0.15092(1) d (∼3.622 h) has been detected, which is interpreted as the orbital period of the system. This value differs significantly from the period of 0.16366(55) d (∼3.928 h) obtained by Pretorius & Knigge (2008) from time-resolved spectroscopy. The discrepancy is easily explained by the periodogram of the spectroscopic data (bottom-right plot in their Fig. 3) that presents a number of tightly spaced alias peaks, with four to five neighbouring frequencies exhibiting a power within ∼5 per cent of the strength of the one identified as the main peak. In fact, the authors themselves emphasise that problem and point out the two closest peaks corresponding to periods of 4.273 and 3.635 h. The spectroscopic observations were taken on two nights separated by two days, which introduces alias peaks in the periodogram spaced by approximately 0.0208 c/h. Our measured frequency (0.2761 c/h, from ∼3.622 h) lies within 0.001 c/h of their 3.635 h peak (0.2751 c/h), but differs by ∼0.042 c/h from their reported 4.273 h value (0.2340 c/h), consistent with a ±2-d alias. This indicates that 4.273 h is an alias introduced by their observational window. Notably, within the errors, their 3.635 h period agrees very well with the value derived from our eclipse data.
A significant period of 0.14517(3) d is also detected in the power spectrum of J130559, which is 4% shorter than the orbital period. We tentatively interpret the modulation corresponding to this period as a negative superhump. The precession period is then  . In the TESS data from sectors 64 and 65, we find an average period of approximately 3.83 d that closely matches the expected disc-precession period. The occurrence of negative superhumps in CVs is believed to result from the interaction between the secondary stream and the retrograde precession of a tilted disc (Bonnet-Bidaud et al. 1985; Harvey et al. 1995; Wood et al. 2009). As this result is based on purely photometric evidence, the presence of a tilted disc in J130559 remains provisional. Additional phase-resolved spectroscopy and related analysis techniques such as Doppler tomography might have the potential to clarify the origin of such signals, but, to our knowledge, have not yet been applied to the case of tilted accretion discs in CVs.
The shape of suspected negative superhump-phased light curve of this system changes from a single prominent peak to an apparent separation into two peaks in sectors 64 and 65, respectively. Additionally, during the orbit, the secondary eclipse-like feature is visible in sector 64 and seems to disappear in sector 65. According to the current understanding of superhump mechanisms, it is expected that the light distribution in the accretion disc and the location of the light source change over time. As a result, both the orbital and superhump waveforms are likely to be influenced by these variations. The two maxima during the superhump cycle can be attributed to the variable emission of energy caused by the matter stream from the secondary star overflowing the tilted accretion disc and impacting the disc at varying distances from the primary star. The change in the shape of superhump-phased light curve is also evident from the observed disc precession periods, which differ between sectors 64 and 65. This can likely be explained by variations in the location and brightness of light source over time. Such variations in the superhump waveforms have also been observed by Wood et al. (2009) and Bruch (2024), with the latter offering a discussion of how these variations generally vary with different disc precession phases.
Using the negative superhump and orbital periods, the negative period excess is estimated as
 (4)
(4)
The resulting values are −0.0379 ± 0.0002 and −0.0381 ± 0.0003 for sectors 64 and 65, respectively. To date, only 12 CVs have been known to exhibit simultaneous negative superhumps and disc-precession periods (see Armstrong et al. 2013). Recently, LS Cam (Rawat et al. 2022), SDSS J081256.85+191157.8 (Sun et al. 2023), ASASSN-V J113750.23-572234.5, and ASASSN-17qj (Sun et al. 2024) were added to this list. If the observed simultaneous periods are indeed negative superhump and disc-precession signals, then J130559 increases this number to 17, providing a new example for the study of tilted disc precession in CVs. The most widely accepted model to explain the simultaneous presence of the negative superhump and disc-precession periods are the tilted and precessing (or ‘wobbling’) disc model, where lines of nodes of the accretion disc precess retrogradely. This causes a negative superhump period to arise due to the interaction between precession and orbital motions, although there is still no consensus regarding the exact physical process. In several studies, hydrodynamic simulations indicate that the tilted accretion disc responsible for negative superhumps might not be a rigid structure with a fixed inclination. Instead, it may behave as an unsteady, fluidic configuration that exhibits internal pressure-driven flows, variable vertical structure, and asymmetric or localised surface disturbances (‘bumps’) that can extend beyond the disc plane (Montgomery 2009; Wood et al. 2009; Thomas & Wood 2015). These features could play a critical role in shaping the observed photometric modulations.
Using the relation between ϵ− and q given by Wood et al. (2009),
 (5)
(5)
the mass ratio is estimated to be approximately 0.267 and 0.270 for sectors 64 and 65, respectively. These estimated mass ratios seem consistent with the improved mass ratio versus ϵ− relation proposed by Stefanov & Stefanov (2023), as shown in their Figure 10b. With a secondary mass of 0.26 M⊙ (Knigge et al. 2011) and an average mass ratio of approximately 0.27, the mass of the WD is estimated to be ∼0.96 M⊙ for J130559.
5. Summary
In summary, a prolonged outburst associated with the precursor outburst is observed during the TESS observations of J1100, where prominent superhumps emerged during the maximum of the outburst, with a period of approximately 0.06786 d. The superhump period is found to vary, becoming shorter during the later phases as the outbursts progress. The change in the superhump period can be attributed to variations in the disc radius throughout the super-outburst phases, supporting the thermal-tidal instability model for the super-outburst of SU UMa stars. Additionally, the amplitude and shape of the superhumps vary throughout the various phases of the outburst. During the early phases, the superhump signal seems to arise from viscous dissipation in the periodically deforming disc. However, in the later phases, a second peak-like structure appears, although it is not particularly prominent. If this feature is indeed a secondary superhump maximum, it could be due to the late stream-dominated source. For J0935, a disc-precession period of approximately 2.36 d is observed, along with a positive superhump period of ∼0.06584 d, which differs by 3% from the orbital period. Such signals were not reported in earlier studies and may result from the prograde rotation of the deformed disc. In spite of the fact that the presence of superhumps and a short orbital period are mostly indicative of an SU UMa-type object, the complete lack of outburst activity, the characteristics of the discovery spectrum, and the absolute magnitude favor the interpretation that J0935 could be a high mass-transfer CV below the period gap; in particular, it might be a rare type of nova-like variable or a high-luminosity intermediate polar. This makes it an intriguing target for follow-up studies because such objects are in contradiction to what is expected from our understanding of CV evolution. An average periodicity of ∼3.83 d, along with periodicities of approximately 0.15092 d and 0.14517 d, are detected in J130559. The 0.15092 d signal confirms, for the first time, the orbital period of the system. The other two signals can be provisionally identified as the negative superhump and disc-precession periods. If the identified simultaneous signals truly reflect the negative superhump and disc-precession periods, then their origin might lie in the retrograde precession of a tilted disc and the interaction between the secondary stream and this precession, providing a new example for the study of tilted disc precession in CVs. The change in the shape of probable superhump light curves during different epochs is likely to be explained by variations in the location and brightness of the light source over time.
Acknowledgments
We thank the anonymous referee for providing constructive comments and suggestions, which have significantly improved the manuscript. AJ and MC acknowledge support from the Centro de Astrofisica y Tecnologias Afines (CATA) fellowship via grant Agencia Nacional de Investigacion Desarrollo (ANID), BASAL FB210003. Additional support for MC is provided by ANID’s FONDECYT Regular grant 1231637 and ANID’s Millennium Science Initiative through grants ICN12_009 and AIM23-0001, awarded to the Millennium Institute of Astrophysics (MAS). CT acknowledges financial support by FONDECYT Regular Grant No 1211941. This paper includes data collected with the TESS mission, obtained from the MAST data archive at the Space Telescope Science Institute (STScI). Funding for the TESS mission is provided by the NASA Explorer Program. AJ acknowledges J. Joshi for reading our work and providing helpful comments.
References
- Abril, J., Schmidtobreick, L., Ederoclite, A., & López-Sanjuan, C. 2020, MNRAS, 492, L40 [NASA ADS] [CrossRef] [Google Scholar]
- Armstrong, E., Patterson, J., Michelsen, E., et al. 2013, MNRAS, 435, 707 [NASA ADS] [CrossRef] [Google Scholar]
- Bailer-Jones, C. A. L., Rybizki, J., Fouesneau, M., Demleitner, M., & Andrae, R. 2021, AJ, 161, 147 [Google Scholar]
- Bellm, E., Kulkarni, S., & Graham, M. 2019, Am. Astron. Soc. Meet. Abstr., 233, 363.08 [Google Scholar]
- Bonnet-Bidaud, J. M., Motch, C., & Mouchet, M. 1985, A&A, 143, 313 [NASA ADS] [Google Scholar]
- Bruch, A. 2023a, MNRAS, 519, 352 [Google Scholar]
- Bruch, A. 2023b, MNRAS, 525, 1953 [CrossRef] [Google Scholar]
- Bruch, A. 2024, ApJS, 273, 6 [NASA ADS] [CrossRef] [Google Scholar]
- Cleveland, W. S. 1979, J. Am. Stat. Assoc., 74, 829 [Google Scholar]
- Dekany, R., Smith, R. M., Riddle, R., et al. 2020, PASP, 132, 038001 [NASA ADS] [CrossRef] [Google Scholar]
- Drake, A. J., Djorgovski, S. G., Mahabal, A., et al. 2009, ApJ, 696, 870 [Google Scholar]
- Gaia Collaboration (Prusti, T., et al.) 2016, A&A, 595, A1 [NASA ADS] [CrossRef] [EDP Sciences] [Google Scholar]
- Gaia Collaboration (Vallenari, A., et al.) 2023, A&A, 674, A1 [NASA ADS] [CrossRef] [EDP Sciences] [Google Scholar]
- Gao, W., Li, Z., Wu, X., Zhang, Z., & Li, Y. 1999, ApJ, 527, L55 [Google Scholar]
- Graham, M. J., Kulkarni, S. R., Bellm, E. C., et al. 2019, PASP, 131, 078001 [Google Scholar]
- Hardy, L. K., McAllister, M. J., Dhillon, V. S., et al. 2017, MNRAS, 465, 4968 [CrossRef] [Google Scholar]
- Harvey, D., Skillman, D. R., Patterson, J., & Ringwald, F. A. 1995, PASP, 107, 551 [Google Scholar]
- Hellier, C. 2001, Cataclysmic Variable Stars– How and Why They Vary (New York: Springer) [Google Scholar]
- Hillman, Y., Shara, M. M., Prialnik, D., & Kovetz, A. 2020, Nat. Astron., 4, 886 [Google Scholar]
- Horne, J. H., & Baliunas, S. L. 1986, ApJ, 302, 757 [Google Scholar]
- Kafka, S. 2021, Observations from the AAVSO International Database, https://www.aavso.org [Google Scholar]
- Kato, T. 2022, ArXiv e-prints [arXiv:2201.02945] [Google Scholar]
- Kato, T., Imada, A., Uemura, M., et al. 2009, PASJ, 61, S395 [NASA ADS] [Google Scholar]
- Knigge, C., Baraffe, I., & Patterson, J. 2011, ApJS, 194, 28 [Google Scholar]
- Lenz, P., & Breger, M. 2004, in The A-Star Puzzle, eds. J. Zverko, J. Ziznovsky, S. J. Adelman, & W. W. Weiss, IAU Symp., 224, 786 [Google Scholar]
- Lomb, N. R. 1976, Ap&SS, 39, 447 [Google Scholar]
- Montgomery, M. M. 2009, ApJ, 705, 603 [NASA ADS] [CrossRef] [Google Scholar]
- Mukai, K., & Pretorius, M. L. 2023, MNRAS, 523, 3192 [Google Scholar]
- Osaki, Y. 1974, PASJ, 26, 429 [NASA ADS] [Google Scholar]
- Osaki, Y. 1989, PASJ, 41, 1005 [NASA ADS] [Google Scholar]
- Osaki, Y. 1996, PASP, 108, 39 [NASA ADS] [CrossRef] [Google Scholar]
- Osaki, Y., & Kato, T. 2013, PASJ, 65, 95 [Google Scholar]
- Osaki, Y., & Kato, T. 2014, PASJ, 66, 15 [NASA ADS] [CrossRef] [Google Scholar]
- Patterson, J., & Warner, B. 1998, PASP, 110, 1026 [Google Scholar]
- Patterson, J., Jablonski, F., Koen, C., O’Donoghue, D., & Skillman, D. R. 1995, PASP, 107, 1183 [Google Scholar]
- Patterson, J., Kemp, J., Saad, J., et al. 1997, PASP, 109, 468 [CrossRef] [Google Scholar]
- Patterson, J., Kemp, J., Skillman, D. R., et al. 1998, PASP, 110, 1290 [Google Scholar]
- Patterson, J., Kemp, J., Harvey, D. A., et al. 2005, PASP, 117, 1204 [Google Scholar]
- Patterson, J., Uthas, H., Kemp, J., et al. 2013, MNRAS, 434, 1902 [NASA ADS] [CrossRef] [Google Scholar]
- Pearson, K. J. 2006, MNRAS, 371, 235 [NASA ADS] [CrossRef] [Google Scholar]
- Pretorius, M. L., & Knigge, C. 2008, MNRAS, 385, 1471 [NASA ADS] [CrossRef] [Google Scholar]
- Rawat, N., Pandey, J. C., Joshi, A., & Yadava, U. 2022, MNRAS, 512, 6054 [Google Scholar]
- Ricker, G. R., Winn, J. N., Vanderspek, R., et al. 2015, J. Astron. Telesc. Instrum. Syst., 1, 014003 [Google Scholar]
- Roberts, D. H., Lehar, J., & Dreher, J. W. 1987, AJ, 93, 968 [Google Scholar]
- Scargle, J. D. 1982, ApJ, 263, 835 [Google Scholar]
- Schmidtobreick, L. 2015, The Golden Age of Cataclysmic Variables and Related Objects– III (Golden2015), 34 [Google Scholar]
- Schmidtobreick, L., Papadaki, C., Tappert, C., & Ederoclite, A. 2008, MNRAS, 389, 1345 [NASA ADS] [CrossRef] [Google Scholar]
- Selvelli, P., & Gilmozzi, R. 2019, A&A, 622, A186 [NASA ADS] [CrossRef] [EDP Sciences] [Google Scholar]
- Smak, J. 2020, Acta Astron., 70, 313 [NASA ADS] [Google Scholar]
- Southworth, J., Tappert, C., Gänsicke, B. T., & Copperwheat, C. M. 2015, A&A, 573, A61 [NASA ADS] [CrossRef] [EDP Sciences] [Google Scholar]
- Stefanov, S. Y., & Stefanov, A. K. 2023, MNRAS, 520, 3355 [Google Scholar]
- Still, M., Howell, S. B., Wood, M. A., Cannizzo, J. K., & Smale, A. P. 2010, ApJ, 717, L113 [NASA ADS] [CrossRef] [Google Scholar]
- Sun, Q.-B., Qian, S.-B., Zhu, L.-Y., et al. 2023, MNRAS, 526, 3730 [Google Scholar]
- Sun, Q.-B., Qian, S.-B., Zhu, L.-Y., et al. 2024, ApJ, 962, 123 [Google Scholar]
- Szkody, P., Henden, A., Agüeros, M., et al. 2006, AJ, 131, 973 [Google Scholar]
- Szkody, P., Anderson, S. F., Hayden, M., et al. 2009, AJ, 137, 4011 [NASA ADS] [CrossRef] [Google Scholar]
- Thomas, D. M., & Wood, M. A. 2015, ApJ, 803, 55 [NASA ADS] [CrossRef] [Google Scholar]
- Vogt, N. 1974, A&A, 36, 369 [NASA ADS] [Google Scholar]
- Warner, B. 1987, MNRAS, 227, 23 [NASA ADS] [Google Scholar]
- Warner, B. 1995, Cataclysmic Var. Star, Cambridge Astrophys. Ser., 28 [Google Scholar]
- Whitehurst, R. 1988, MNRAS, 232, 35 [NASA ADS] [Google Scholar]
- Whitehurst, R., & King, A. 1991, MNRAS, 249, 25 [NASA ADS] [CrossRef] [Google Scholar]
- Wood, M. A., Thomas, D. M., & Simpson, J. C. 2009, MNRAS, 398, 2110 [CrossRef] [Google Scholar]
- Wood, M. A., Still, M. D., Howell, S. B., Cannizzo, J. K., & Smale, A. P. 2011, ApJ, 741, 105 [NASA ADS] [CrossRef] [Google Scholar]
Appendix A: Additional table
Observed times of maximum (BJD) and O-C values.
All Tables
Periods corresponding to the dominant peaks in the power spectra of J1100, J0935, and J130559, determined using Period04.
All Figures
|
Fig. 1. (a) TESS light curve of J1100, displaying a super-outburst. A vertical blue dashed line at BJD 2460270.5020 represents a conservative estimate of the start time of the outburst. The solid yellow line represents the smoothed light curve obtained using the LOESS fit. Middle: Detrended light curves after subtracting the smoothed light curve. Bottom: O-C curves of superhumps. The light green vertical dashed lines represent a clear period transition in the O-C trends. (b) Zoomed-in segment of the TESS light curve over ∼0.7–0.8 d, corresponding to the shaded regions highlighted in the top panel of Figure 1a, shown for clarity. |
| In the text | |
|
Fig. 2. LS and Period04 power spectra obtained from the combined detrended TESS light curve of J1100. The significant signals corresponding to the superhump frequency (SH) and its harmonics are distinctly marked. The significant frequencies observed in the power spectrum lie above the 95% confidence level, which is represented by the dashed horizontal green line. |
| In the text | |
|
Fig. 3. (a) Top panel: Full TESS light curve of J0935. Bottom panel: Zoomed-in segment of the TESS light curve over ∼0.25 d, corresponding to the shaded region highlighted in the top panel, shown for clarity. (b) LS, CLEAN, and Period04 power spectra obtained from the combined TESS data. The significant signals are distinctly marked. A zoomed-in plot corresponding to the orbital (Ω), positive superhump (SH+), and prograde disc-precession ( |
| In the text | |
|
Fig. 4. Superhump and orbital phased light curves of J0935. |
| In the text | |
|
Fig. 5. (a) Full TESS light curves of J130559 for sectors 64 and 65. (b) Zoomed-in segment of the TESS light curve over ∼1 d, corresponding to the shaded regions highlighted in Figure 5a, shown for clarity. |
| In the text | |
|
Fig. 6. LS, CLEAN, and Period04 power spectra of J130559 obtained from the TESS data for (a) sector 64 and (b) sector 65. The significant signals are distinctly marked. A zoomed-in plot corresponding to the orbital (Ω), negative superhump (SH−), and retrograde disc-precession ( |
| In the text | |
|
Fig. 7. Superhump-and-orbital phase folded light curves of J130559 for (a) sector 64 and (b) sector 65. |
| In the text | |
|
Fig. 8. Distribution of mass ratio versus orbital period for known short-period CVs. The dashed blue line shows the standard CV evolutionary track from Knigge et al. (2011), while the solid red line represents their optimal binary track. The green points represent the mass ratio and period reported in the literature (Kato 2022). V1159 Ori and ER UMa are represented by an orange square and a brown triangle, respectively, while J0935 (our work) is shown as a magenta star. |
| In the text | |
Current usage metrics show cumulative count of Article Views (full-text article views including HTML views, PDF and ePub downloads, according to the available data) and Abstracts Views on Vision4Press platform.
Data correspond to usage on the plateform after 2015. The current usage metrics is available 48-96 hours after online publication and is updated daily on week days.
Initial download of the metrics may take a while.