Fig. 6.
Download original image
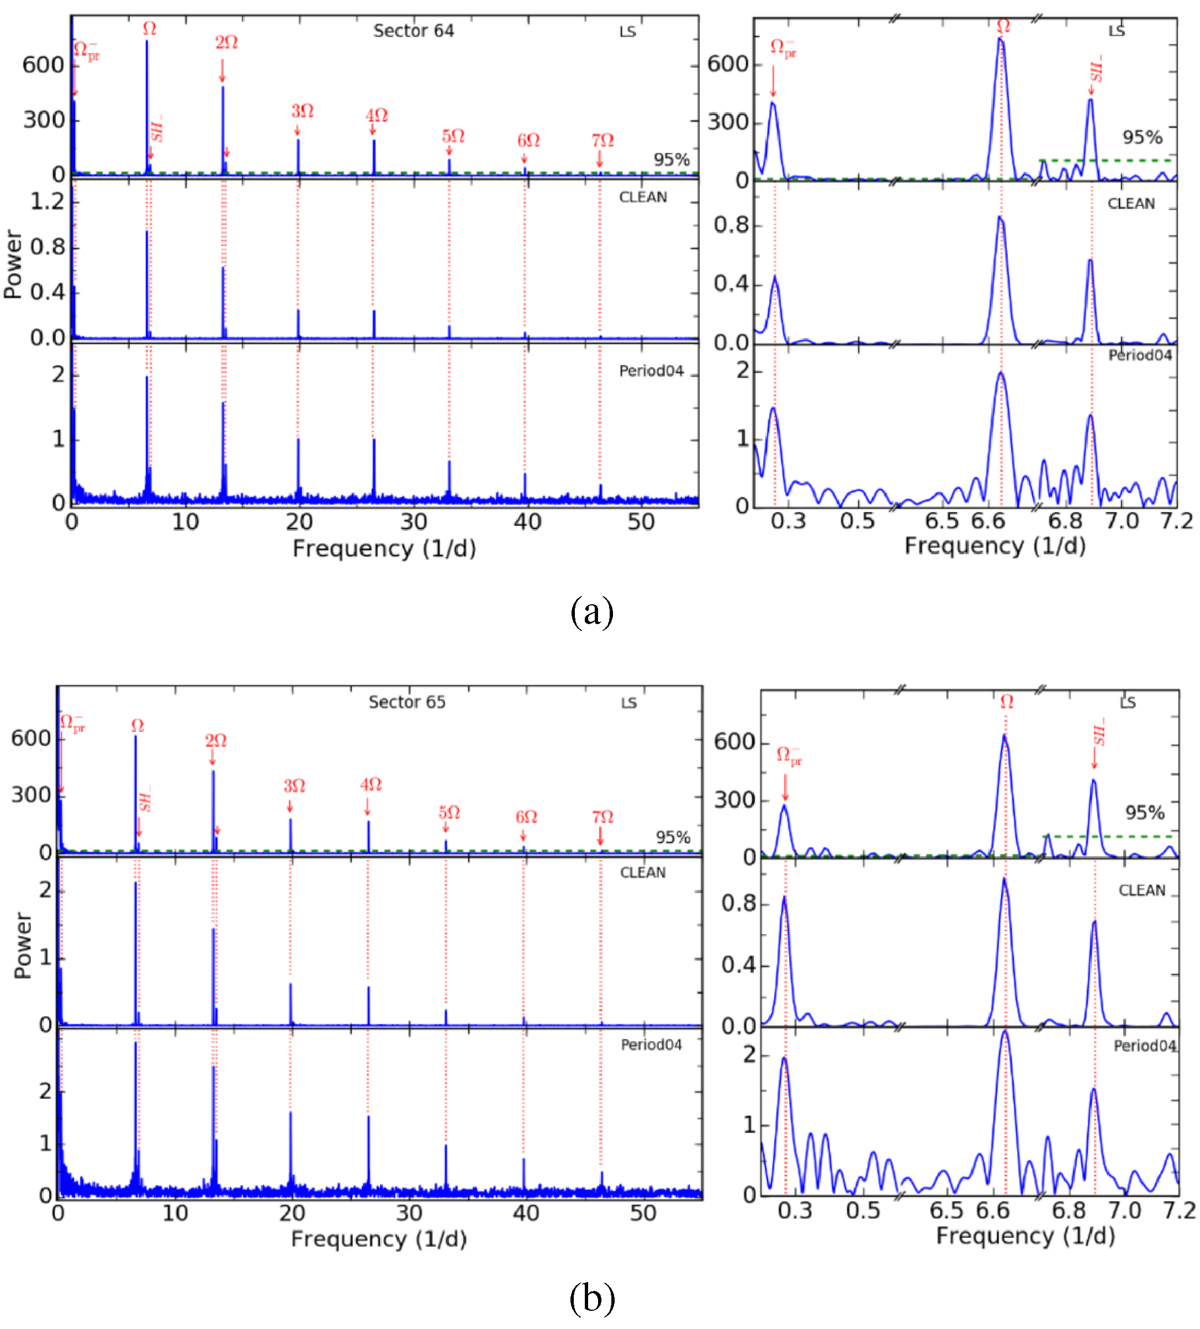
LS, CLEAN, and Period04 power spectra of J130559 obtained from the TESS data for (a) sector 64 and (b) sector 65. The significant signals are distinctly marked. A zoomed-in plot corresponding to the orbital (Ω), negative superhump (SH−), and retrograde disc-precession (![]() ) frequencies is also shown on the right. All observed frequencies in the power spectra lie above the 95% confidence level, which is represented by the dashed horizontal green line.
) frequencies is also shown on the right. All observed frequencies in the power spectra lie above the 95% confidence level, which is represented by the dashed horizontal green line.
Current usage metrics show cumulative count of Article Views (full-text article views including HTML views, PDF and ePub downloads, according to the available data) and Abstracts Views on Vision4Press platform.
Data correspond to usage on the plateform after 2015. The current usage metrics is available 48-96 hours after online publication and is updated daily on week days.
Initial download of the metrics may take a while.