Fig. 12.
Download original image
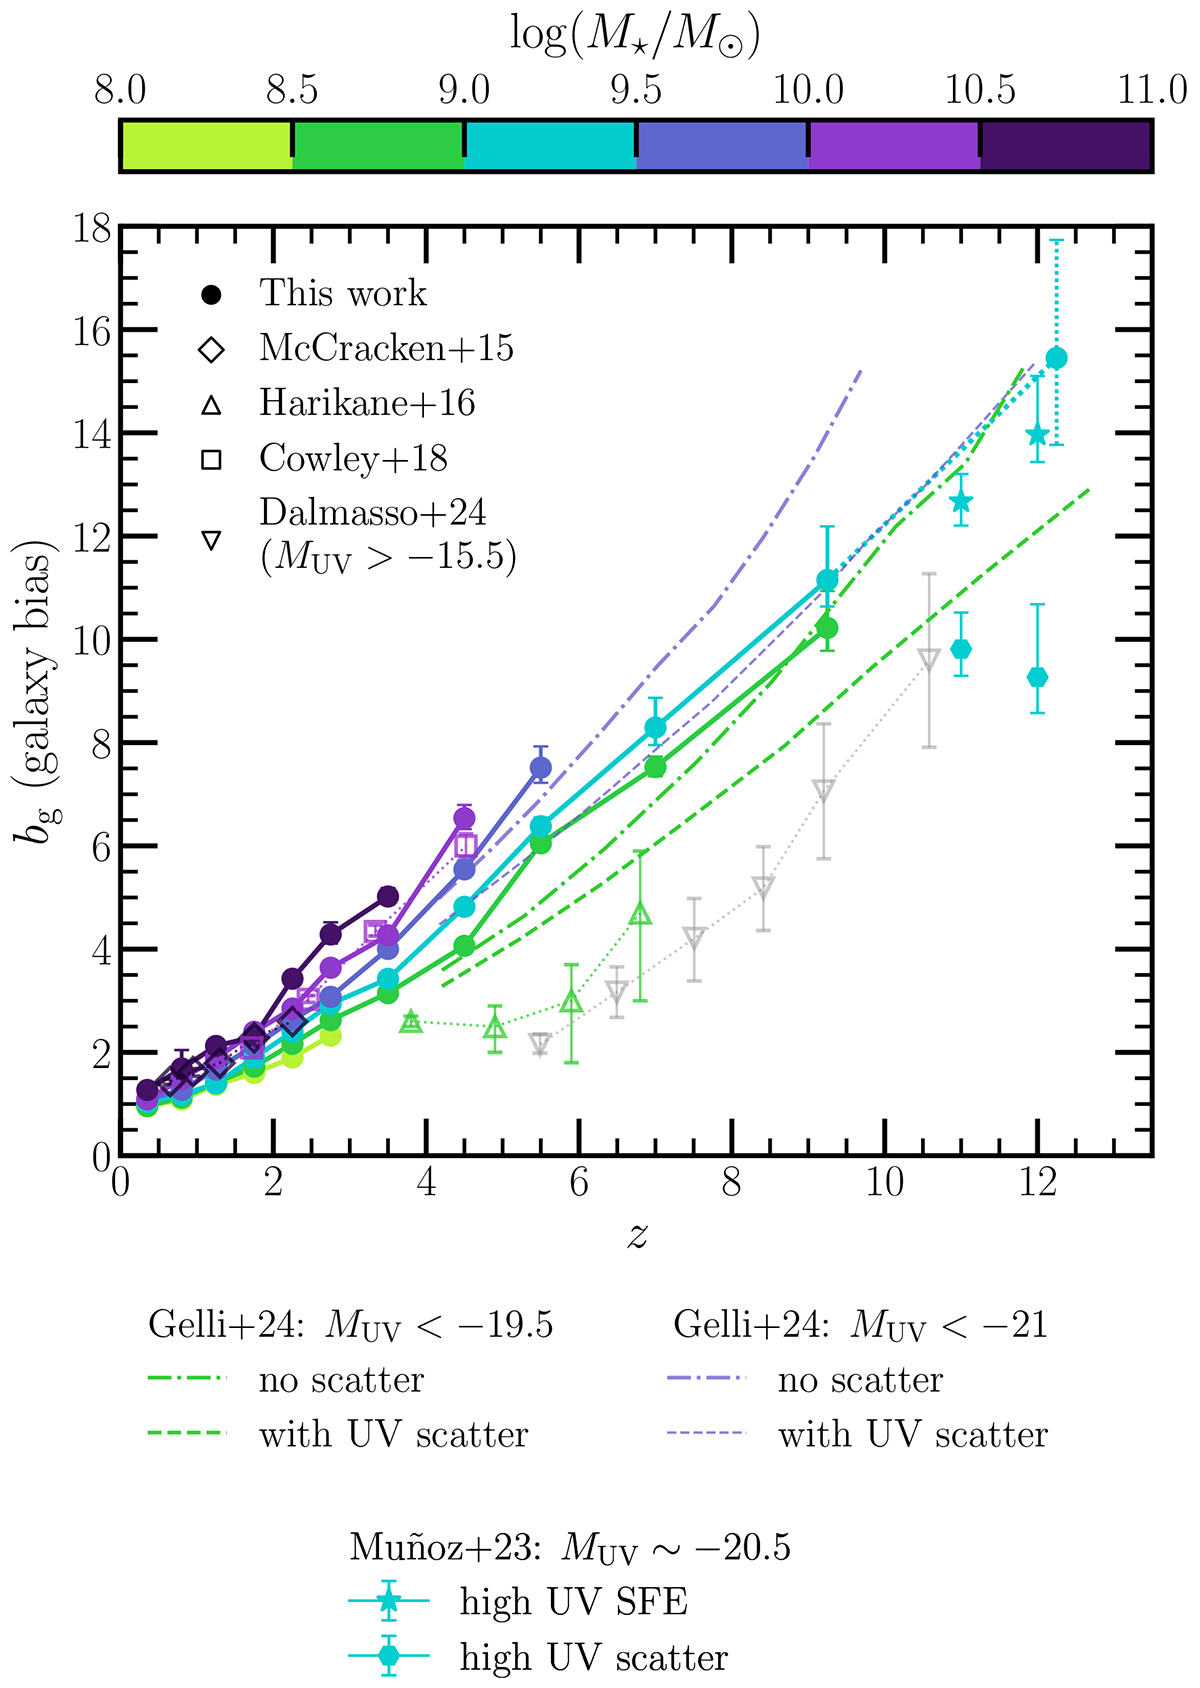
Evolution of the galaxy bias with redshift, for different stellar mass thresholds, derived from the HOD modeling of our clustering measurements. The point at z ∼ 12 is represented in dotted lines because it is considered less certain. Predictions of the galaxy bias as a function of UV magnitude by Muñoz et al. (2023) and Gelli et al. (2024) are superposed, with and without implementation of a large scatter in the MUV − Mh relationship to explain the overabundance of bright galaxies at high-z. Literature measurements from McCracken et al. (2015), Harikane et al. (2016), and Cowley et al. (2018) are shown in colors corresponding to their sample threshold mass. The exception is Dalmasso et al. (2024b), which is in gray, since it corresponds to a stellar mass that is below our bin minimum.
Current usage metrics show cumulative count of Article Views (full-text article views including HTML views, PDF and ePub downloads, according to the available data) and Abstracts Views on Vision4Press platform.
Data correspond to usage on the plateform after 2015. The current usage metrics is available 48-96 hours after online publication and is updated daily on week days.
Initial download of the metrics may take a while.