Fig. 1
Download original image
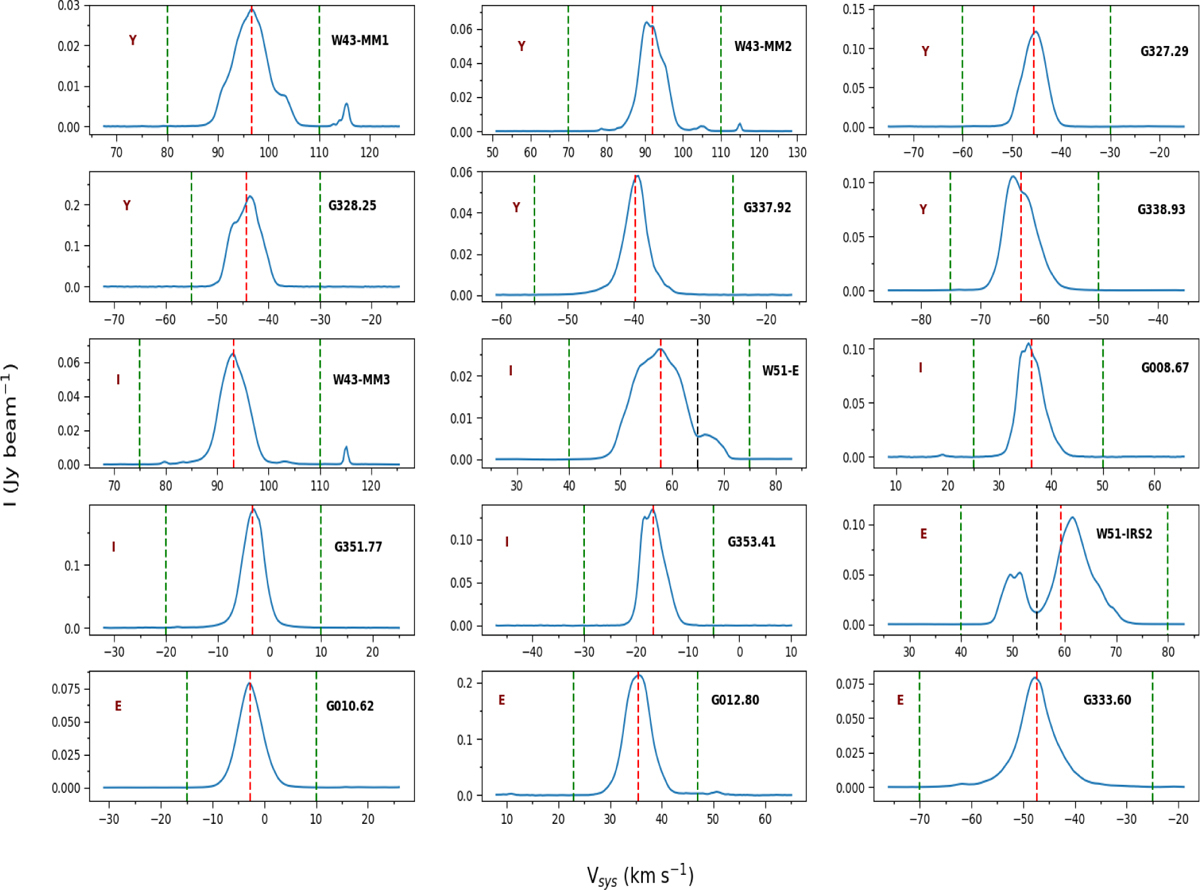
Average C18O (J=2–1) spectrum for 15 different protoclusters. Two vertical green dashed lines indicate the velocity cut-off to measure the systemic velocity (Vsys). The red dashed line represents the measured Vsys based on the C18O (J=2–1) line. In the W51-E and W51-IRS2 regions, the black dashed line indicates the minima between the separation of the two broad clouds. Symbols Y, I, towards and E in the figures denote young, intermediate and evolved protoclusters respectively (see Table 1).
Current usage metrics show cumulative count of Article Views (full-text article views including HTML views, PDF and ePub downloads, according to the available data) and Abstracts Views on Vision4Press platform.
Data correspond to usage on the plateform after 2015. The current usage metrics is available 48-96 hours after online publication and is updated daily on week days.
Initial download of the metrics may take a while.