Fig. C.1
Download original image
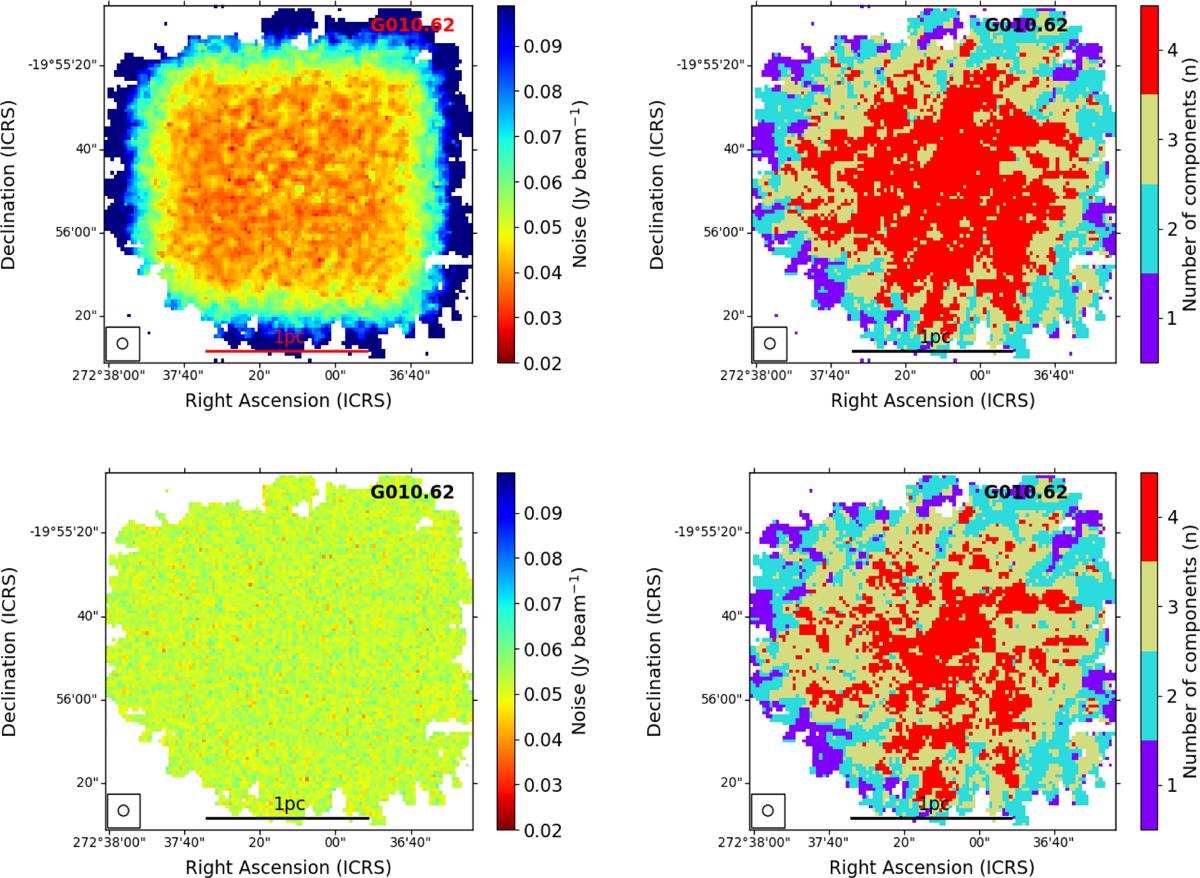
Upper-left figure: Noise map of the G010.62 region (at 2.5″ resolution, same as the dust temperature cube). Upper-right figure: Distribution of number of decomposed components (n) in the G010.62 region. Lower-left figure: Constant noise map at ~0.053 Jy beam−1. Lower-right figure: Distribution of number of decomposed components (n) when the noise level in each pixel is equal to ~0.053 Jy beam−1.
Current usage metrics show cumulative count of Article Views (full-text article views including HTML views, PDF and ePub downloads, according to the available data) and Abstracts Views on Vision4Press platform.
Data correspond to usage on the plateform after 2015. The current usage metrics is available 48-96 hours after online publication and is updated daily on week days.
Initial download of the metrics may take a while.