Fig. D.1
Download original image
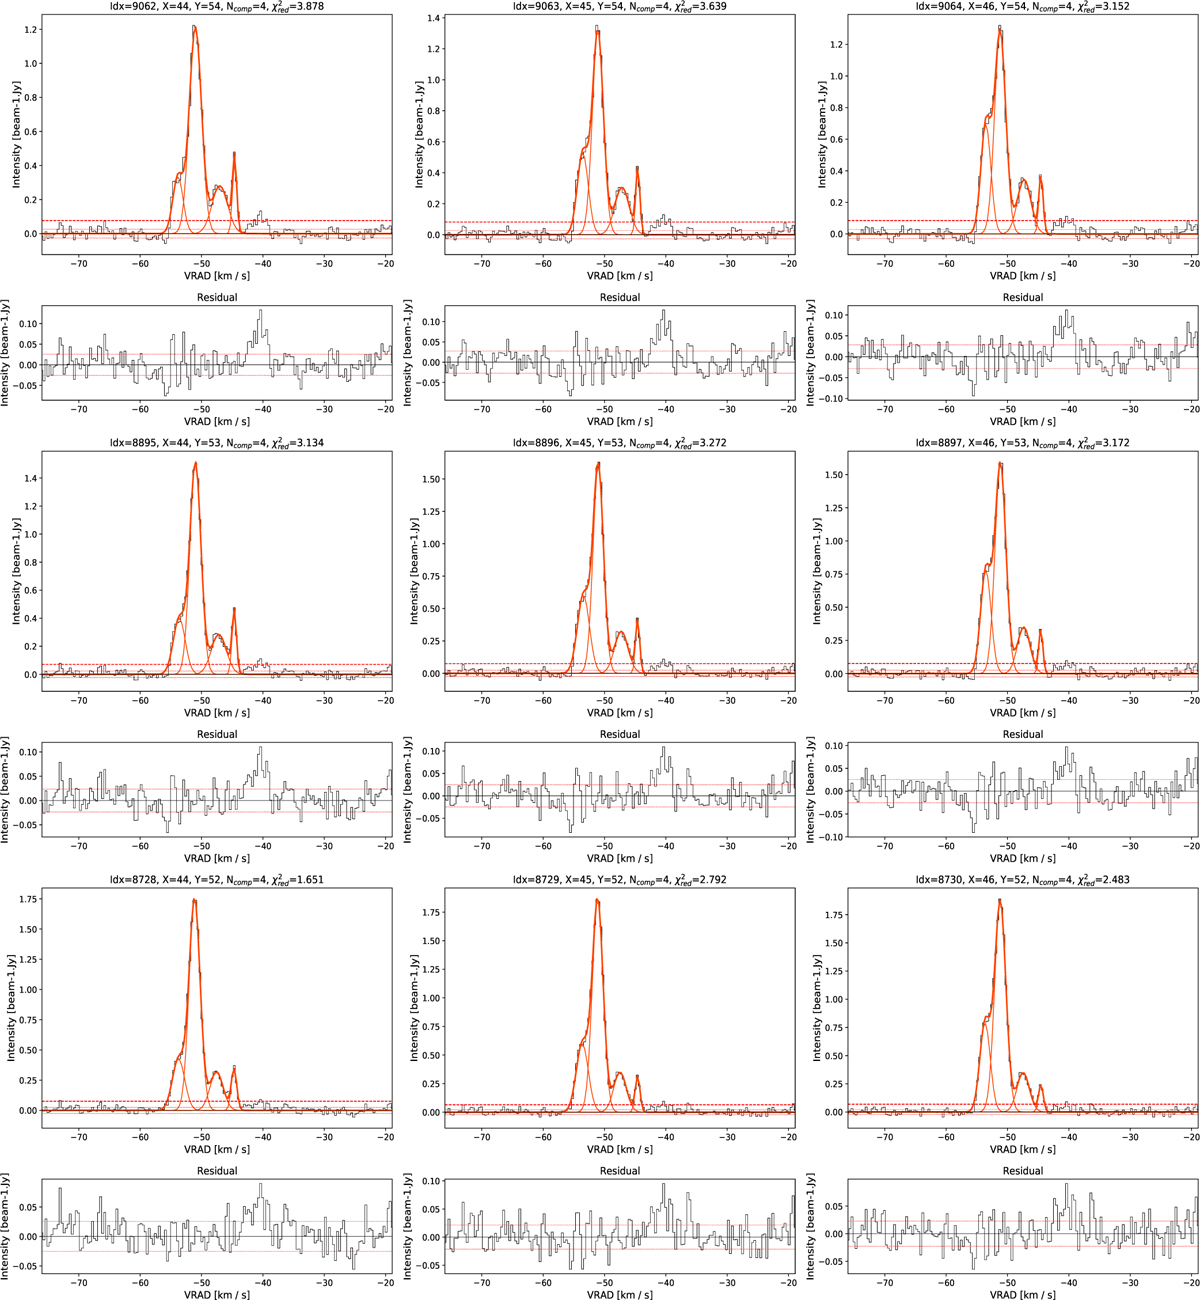
Few samples of model C18O (J = 2–1) spectra toward G333.60 region obtained from Gausspy+ module. First, third, and fifth rows show the observed and model C18O (J = 2–1) spectra in G333.60 region. Black solid line denotes the observed spectra, whereas, red sold lines represent the decomposed and resultant model spectra in G333.60 region. In each of the figures two red dotted horizontal lines denote the ±1σ value of the noise. In addition one solid horizontal red line represents the +3σ noise level of the spectra. In the header of each of the figures idx represents the spectra number that is obtained from the Gausspy+ module. X and Y denote the pixel number in the image cube, Ncomp is the number of decomposed components and ![]() is the reduced chi-squared value after fitting. Second, fourth, and sixth rows represent the residuals of the corresponding spectra after being fitted with model components. Here also two red dotted horizontal lines in each figure denotes the ±1σ value of the noise.
is the reduced chi-squared value after fitting. Second, fourth, and sixth rows represent the residuals of the corresponding spectra after being fitted with model components. Here also two red dotted horizontal lines in each figure denotes the ±1σ value of the noise.
Current usage metrics show cumulative count of Article Views (full-text article views including HTML views, PDF and ePub downloads, according to the available data) and Abstracts Views on Vision4Press platform.
Data correspond to usage on the plateform after 2015. The current usage metrics is available 48-96 hours after online publication and is updated daily on week days.
Initial download of the metrics may take a while.