Fig. F.3
Download original image
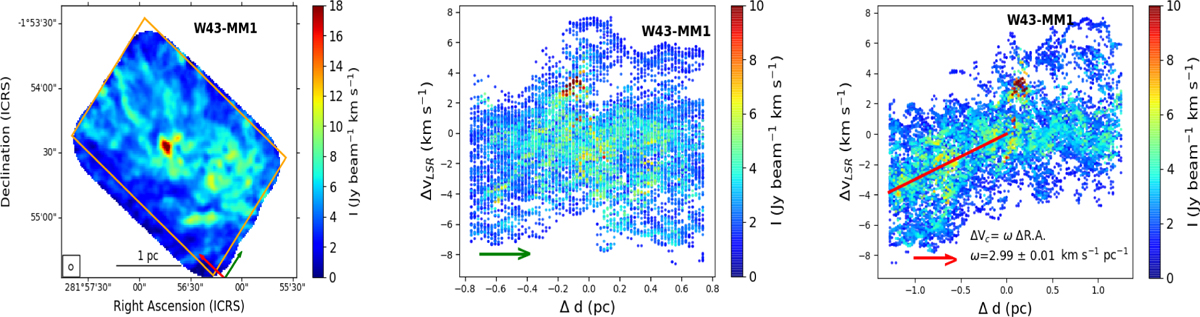
Left figure is the integrated intensity (moment 0) map of W43-MM1 region obtained from 2.5″ circular beam. Here, the orange rectangular region denotes the area where we examine the position-velocity (PV) diagram in two perpendicular directions (toward the green and red arrows). Middle figure is the intensity weighted PV diagram toward the direction of the green arrow mentioned in the left figure. Right figure is the intensity weighted PV diagram toward the direction of the red arrow mentioned in the left figure. Color bars in the Middle and Right figures denote the integrated intensity of the components. The fitted velocity gradient is 2.99 ± 0.01 km s−1 pc−1 which is shown in red solid color.
Current usage metrics show cumulative count of Article Views (full-text article views including HTML views, PDF and ePub downloads, according to the available data) and Abstracts Views on Vision4Press platform.
Data correspond to usage on the plateform after 2015. The current usage metrics is available 48-96 hours after online publication and is updated daily on week days.
Initial download of the metrics may take a while.