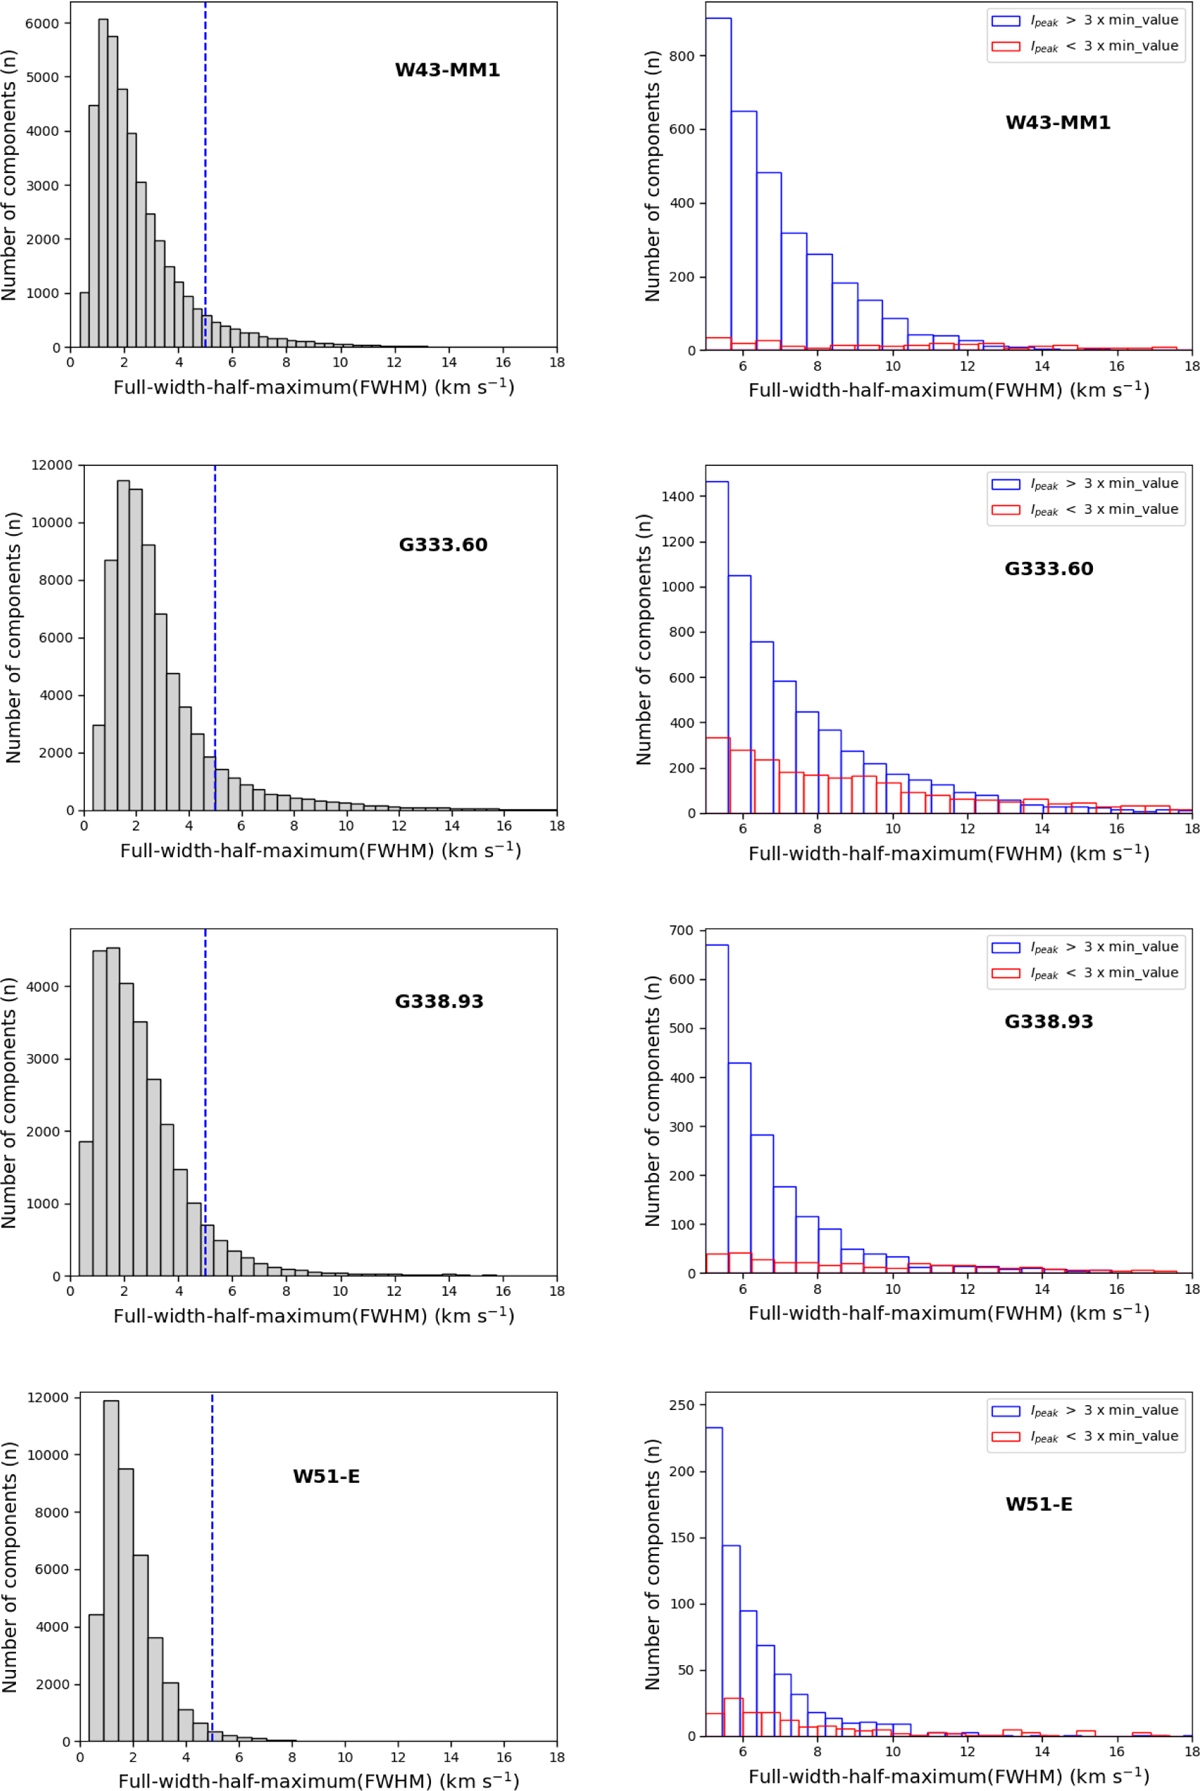
Fig. J.1
Download original image
Left panel in four rows show the histogram plots of the full-width-half-maximum (FWHM) of the C18O (2–1) line components for the W43-MM1, G333.60, G338.93, and W51-E protoclusters respectively. Here the blue dashed line denotes the FWHM value of 5.0 km s−1, above which we consider the components have large wing-like structures. Right panel in four rows show the histogram plots of the components for the four protoclusters whose FWHM are above 5.0 km s−1 and intensity peaks (Ipeak) are above 3× min_value (blue color) and below 3× min_value (red color).
Current usage metrics show cumulative count of Article Views (full-text article views including HTML views, PDF and ePub downloads, according to the available data) and Abstracts Views on Vision4Press platform.
Data correspond to usage on the plateform after 2015. The current usage metrics is available 48-96 hours after online publication and is updated daily on week days.
Initial download of the metrics may take a while.