Open Access
Fig. 4
Download original image
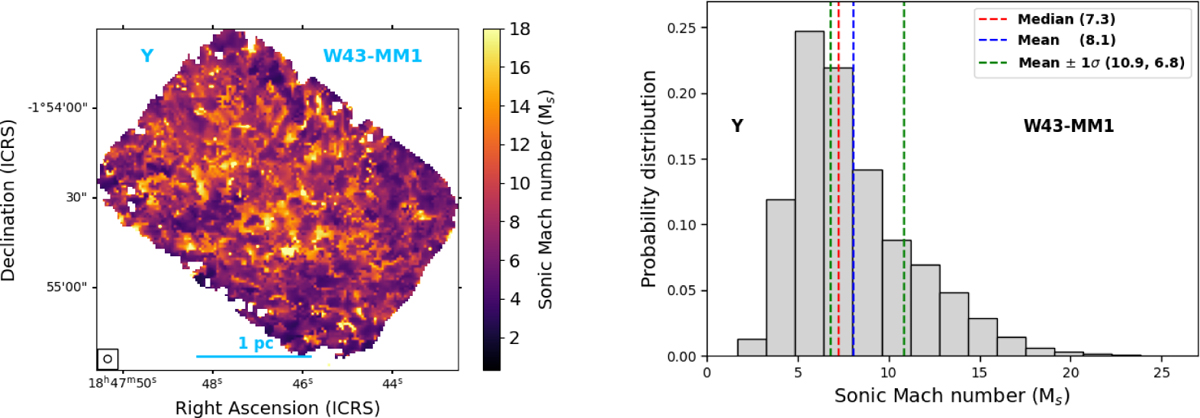
Left: sonic Mach number map in the W43-MM1 protocluster. Right: histogram distribution of the sonic Mach number shown on the left panel. Symbol Y in the figures indicate the young protocluster (see Section 1). We display the remainder of the 15 protoclusters in Appendix H.
Current usage metrics show cumulative count of Article Views (full-text article views including HTML views, PDF and ePub downloads, according to the available data) and Abstracts Views on Vision4Press platform.
Data correspond to usage on the plateform after 2015. The current usage metrics is available 48-96 hours after online publication and is updated daily on week days.
Initial download of the metrics may take a while.