Fig. 5
Download original image
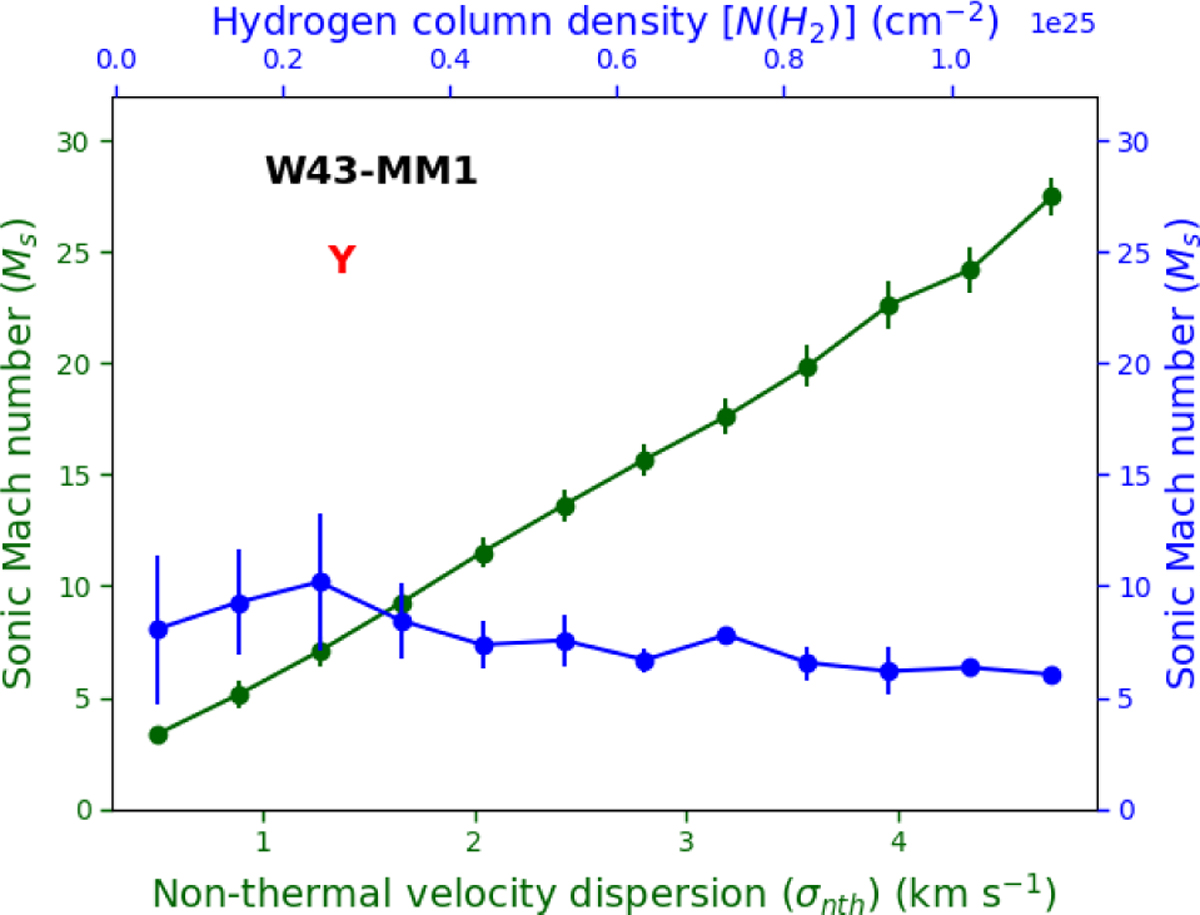
Correlation between (a) the sonic Mach number (Ms) and the non-thermal velocity dispersion (σnth) (green color) and (b) the sonic Mach number (Ms) and the hydrogen column density [N(H2)] (blue color) for W43-MM1. Symbol Y in the figure indicates the young protocluster (see Section 1). We present the reminder of the 15 protoclusters in Appendix I.
Current usage metrics show cumulative count of Article Views (full-text article views including HTML views, PDF and ePub downloads, according to the available data) and Abstracts Views on Vision4Press platform.
Data correspond to usage on the plateform after 2015. The current usage metrics is available 48-96 hours after online publication and is updated daily on week days.
Initial download of the metrics may take a while.