Fig. 6
Download original image
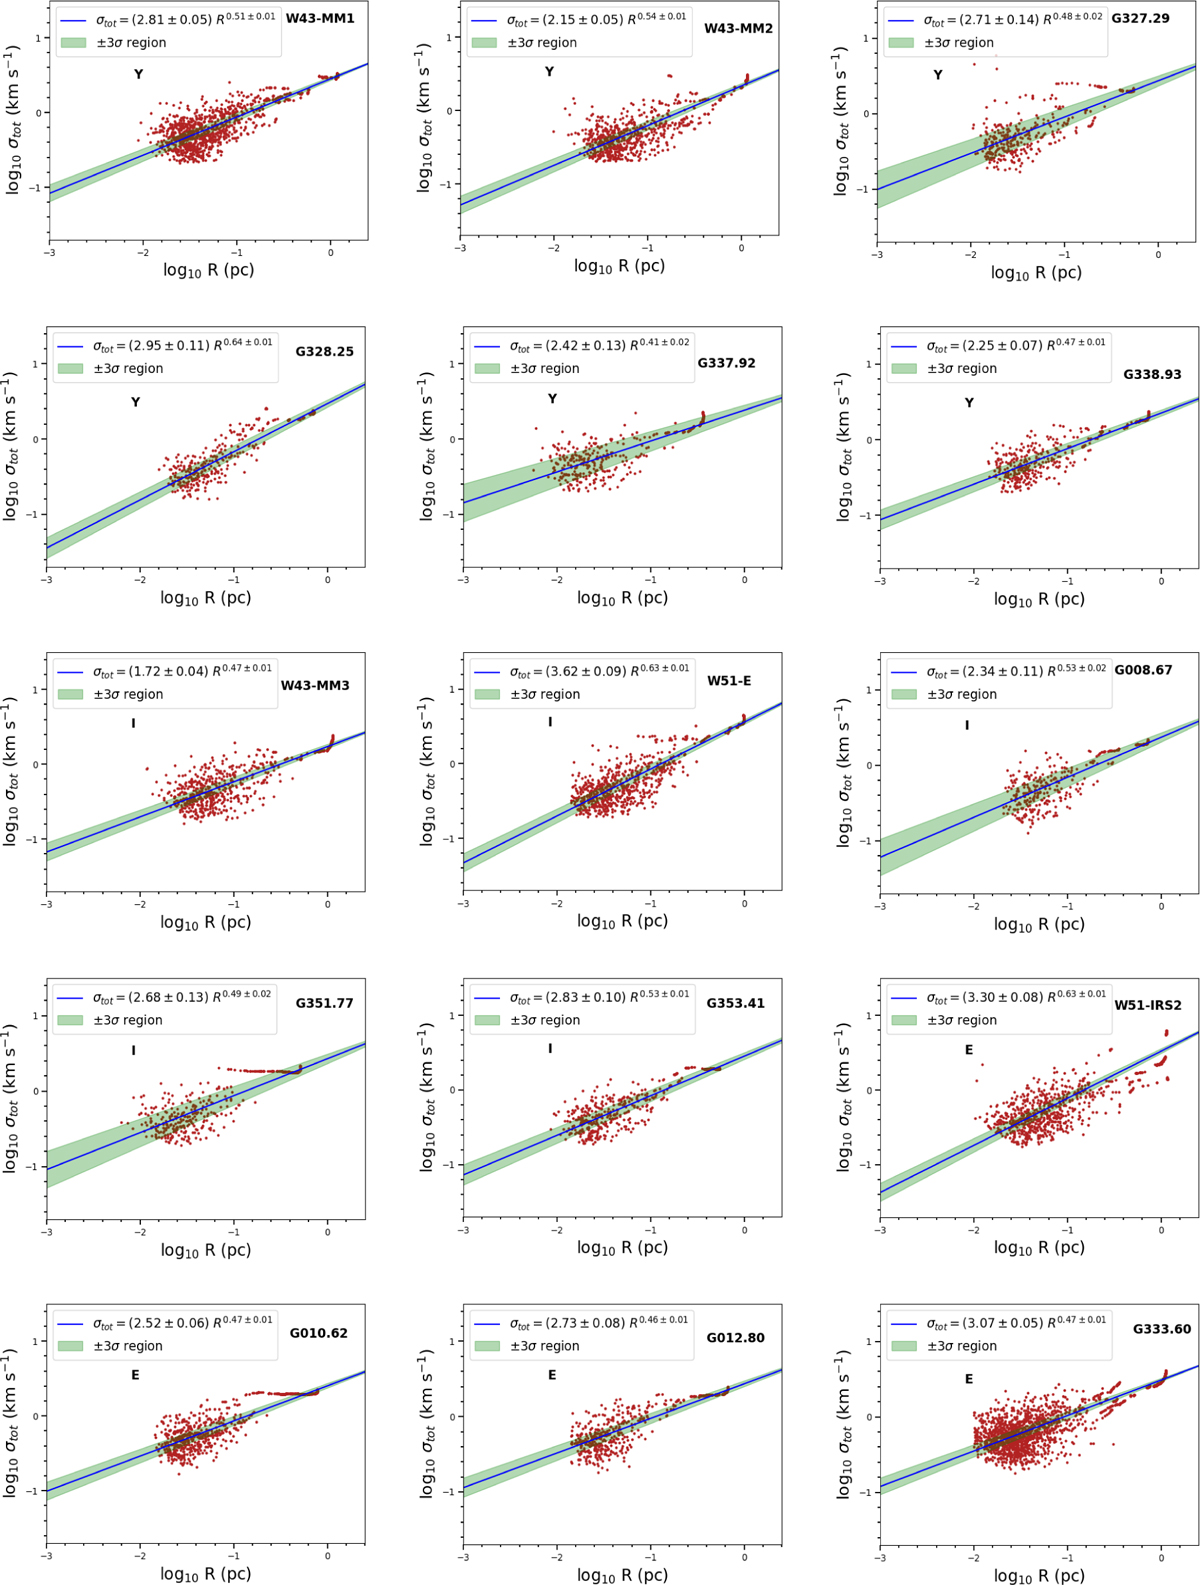
Correlation between velocity dispersion (σtot) and the plane-of-sky projected radius (R) for 15 protoclusters. The red dots represent structures derived using the astrodendro module. The solid blue lines represent the fitted lines for the correlation and the green shaded areas represent the ±3σ regions around the mean fitted values. Symbols Y, I, and E in the figures indicate young, intermediate, and evolved protoclusters respectively (see Section 1).
Current usage metrics show cumulative count of Article Views (full-text article views including HTML views, PDF and ePub downloads, according to the available data) and Abstracts Views on Vision4Press platform.
Data correspond to usage on the plateform after 2015. The current usage metrics is available 48-96 hours after online publication and is updated daily on week days.
Initial download of the metrics may take a while.