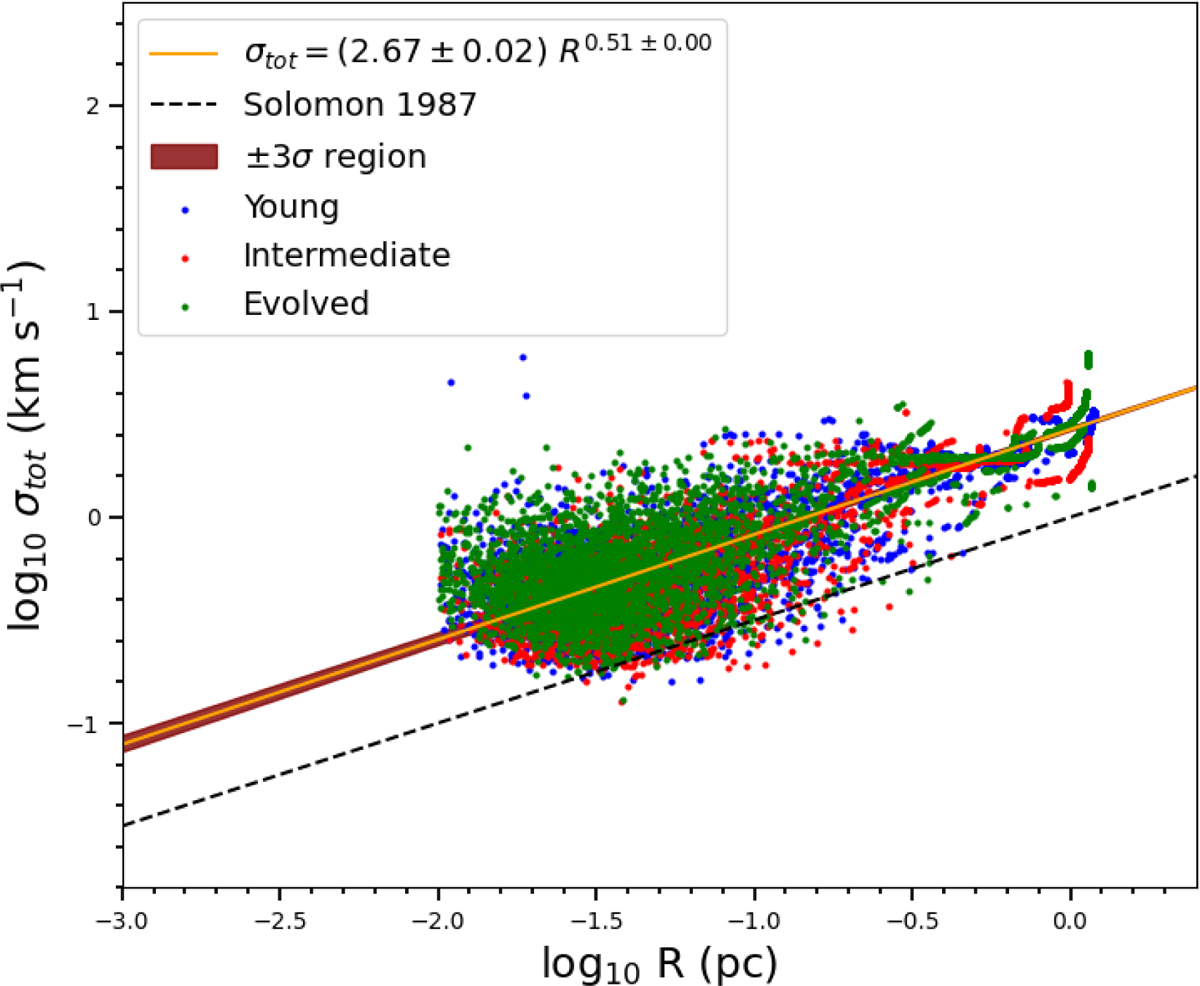
Fig. 7
Download original image
Correlation between velocity dispersion (σtot) and the plane-of-sky projected radius (R) for all 15 protoclusters. Blue, red, and green dots represent the structures for young, intermediate and evolved protoclusters derived using the astrodendro module. The solid orange line represents the fitted line for the correlation and the maroon shaded areas represent the ±3σ regions around the mean fitted value. Black dashed line obtained from the earlier work of Solomon et al. (1987).
Current usage metrics show cumulative count of Article Views (full-text article views including HTML views, PDF and ePub downloads, according to the available data) and Abstracts Views on Vision4Press platform.
Data correspond to usage on the plateform after 2015. The current usage metrics is available 48-96 hours after online publication and is updated daily on week days.
Initial download of the metrics may take a while.