Fig. 10.
Download original image
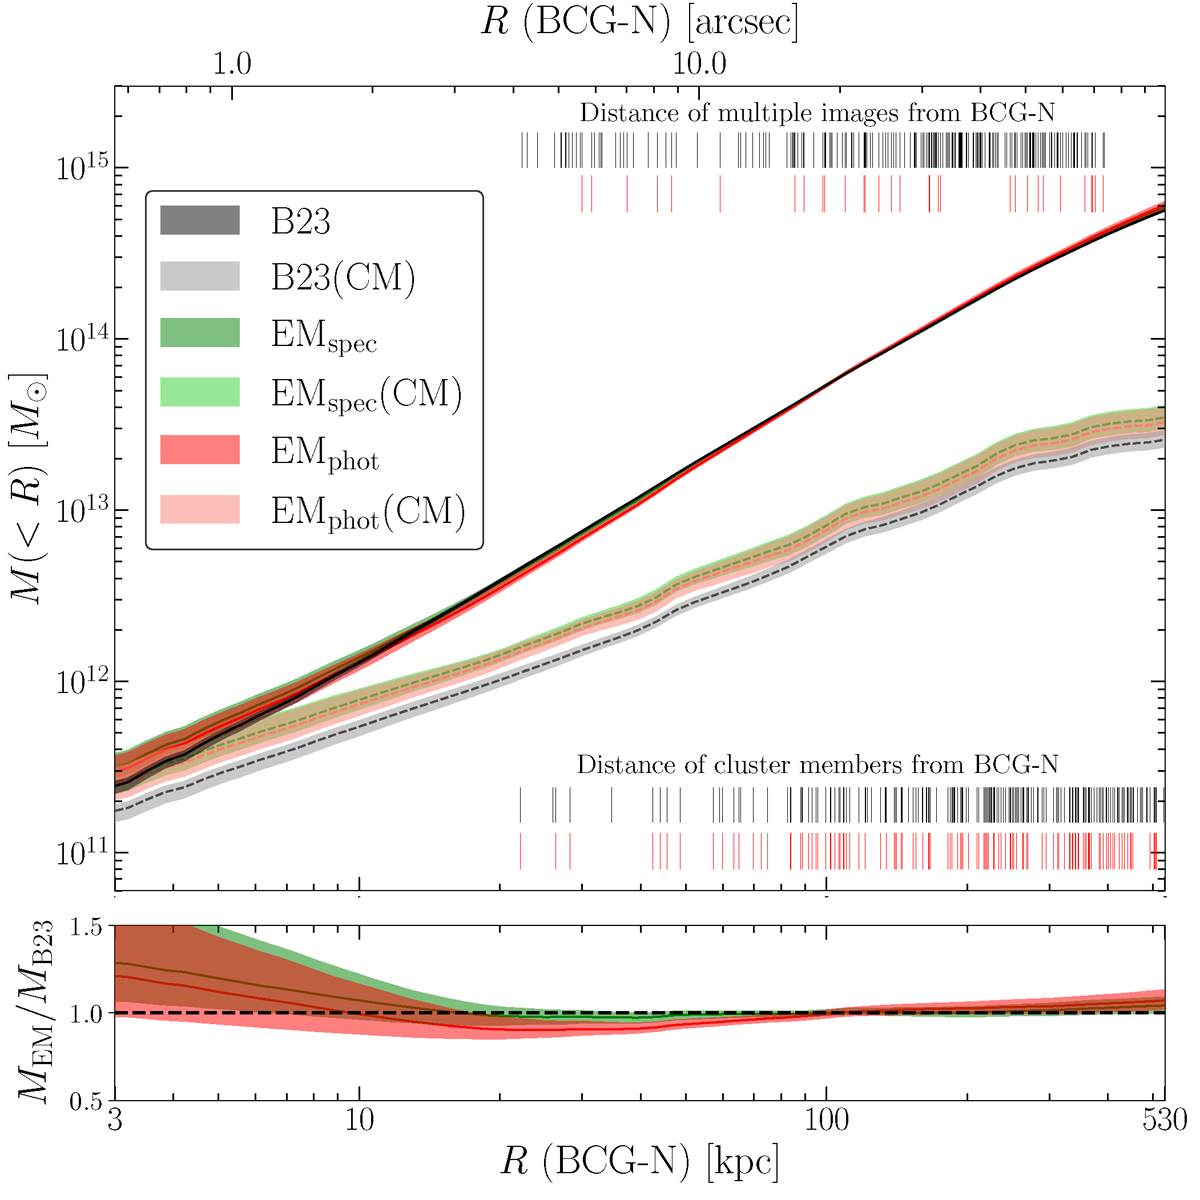
Top panel: Cumulative total mass profiles of MACS J0416 as derived from the B23, EMspec, and EMphot strong lensing models. We show the results for the three models using dark grey, green, and red colours, respectively. The coloured bands indicate the 68.3% confidence intervals. We also show the cumulative total mass profiles for the cluster member component (CM) using lighter colours. The radial distances are measured with respect to the BCG-N. We indicate the positions of multiple images and cluster members used in the Euclid-based and B23 models with red and black vertical sticks at the top and bottom of the figure, respectively. Bottom panel: Ratios between the cumulative total mass profiles derived from the Euclid-based and the B23 models. The coloured bands indicate the 68.3% confidence intervals.
Current usage metrics show cumulative count of Article Views (full-text article views including HTML views, PDF and ePub downloads, according to the available data) and Abstracts Views on Vision4Press platform.
Data correspond to usage on the plateform after 2015. The current usage metrics is available 48-96 hours after online publication and is updated daily on week days.
Initial download of the metrics may take a while.