Fig. 2.
Download original image
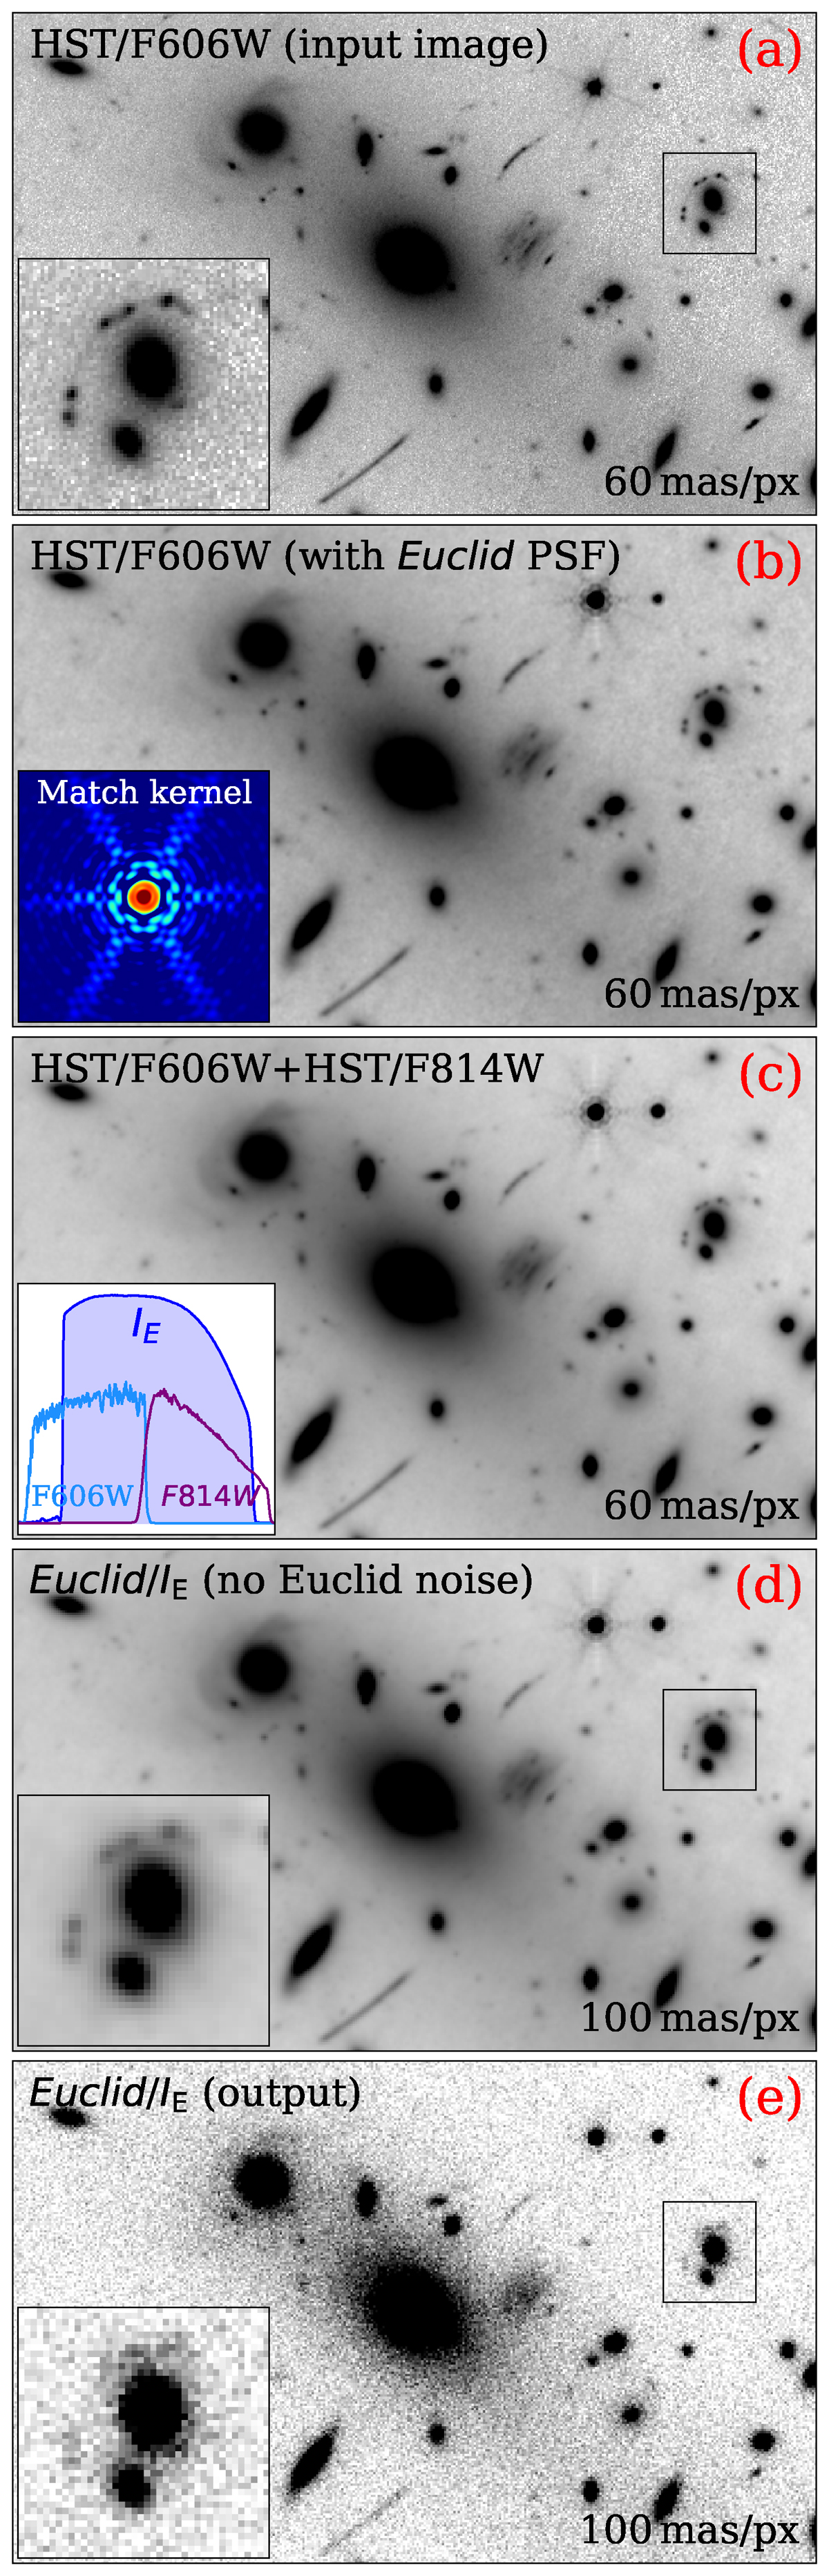
Steps of the Euclidisation pipeline. In the top panel (a), we show the original Hubble F606W image of the galaxy cluster MACS J0416 at z = 0.396. The bottom panel (e) shows the final simulated IE band. The intermediate panels (b), (c), and (d), from top to bottom, illustrate: the convolution to match the Euclid PSF, the result of combining the Hubble F606W and F814W filters to produce the IE band, and the re-binning necessary to match the Euclid pixel scale in the IE band (see Sect. 3).
Current usage metrics show cumulative count of Article Views (full-text article views including HTML views, PDF and ePub downloads, according to the available data) and Abstracts Views on Vision4Press platform.
Data correspond to usage on the plateform after 2015. The current usage metrics is available 48-96 hours after online publication and is updated daily on week days.
Initial download of the metrics may take a while.