Fig. 4.
Download original image
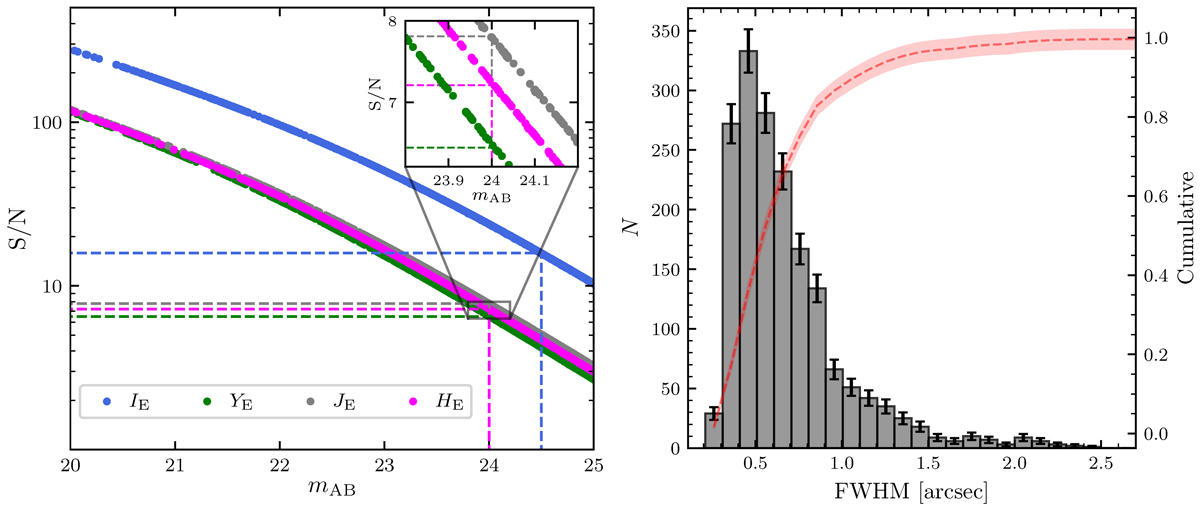
Left: Signal-to-noise ratio (S/N) as a function of the magnitude for the luminous sources detected in the Euclid simulated images of the galaxy cluster MACS J0416. Blue, green, grey, and magenta dots indicate the S/N for galaxies detected in the EuclidIE, YE, JE, and HE images, respectively, as a function of their magnitude in the different bands. These quantities are measured within circular apertures of radius 0![]() 65 for the IE band, and radius
65 for the IE band, and radius ![]() (equivalent in extension to the
(equivalent in extension to the ![]() aperture quoted in Table 1) for the YE, JE, and HE filters. Vertical and horizontal dashed lines mark the values of the limiting S/Ns ((S/N)limIE = 15.9, (S/N)limYE = 6.5, (S/N)limJE = 7.8, and (S/N)limHE = 7.2) and limiting magnitudes (mlimIE = 24.5, mlimYE = 24.0, mlimJE = 24.0, and mlimHE = 24.0). Right: Full width at half maximum (FWHM) distribution (grey) and its cumulative probability distribution (red) estimated for 1748 galaxies in six HFF parallel fields with IE magnitude ≤ 24.5 (i.e. brighter than the limiting magnitude in the IE filter).
aperture quoted in Table 1) for the YE, JE, and HE filters. Vertical and horizontal dashed lines mark the values of the limiting S/Ns ((S/N)limIE = 15.9, (S/N)limYE = 6.5, (S/N)limJE = 7.8, and (S/N)limHE = 7.2) and limiting magnitudes (mlimIE = 24.5, mlimYE = 24.0, mlimJE = 24.0, and mlimHE = 24.0). Right: Full width at half maximum (FWHM) distribution (grey) and its cumulative probability distribution (red) estimated for 1748 galaxies in six HFF parallel fields with IE magnitude ≤ 24.5 (i.e. brighter than the limiting magnitude in the IE filter).
Current usage metrics show cumulative count of Article Views (full-text article views including HTML views, PDF and ePub downloads, according to the available data) and Abstracts Views on Vision4Press platform.
Data correspond to usage on the plateform after 2015. The current usage metrics is available 48-96 hours after online publication and is updated daily on week days.
Initial download of the metrics may take a while.