Fig. 5.
Download original image
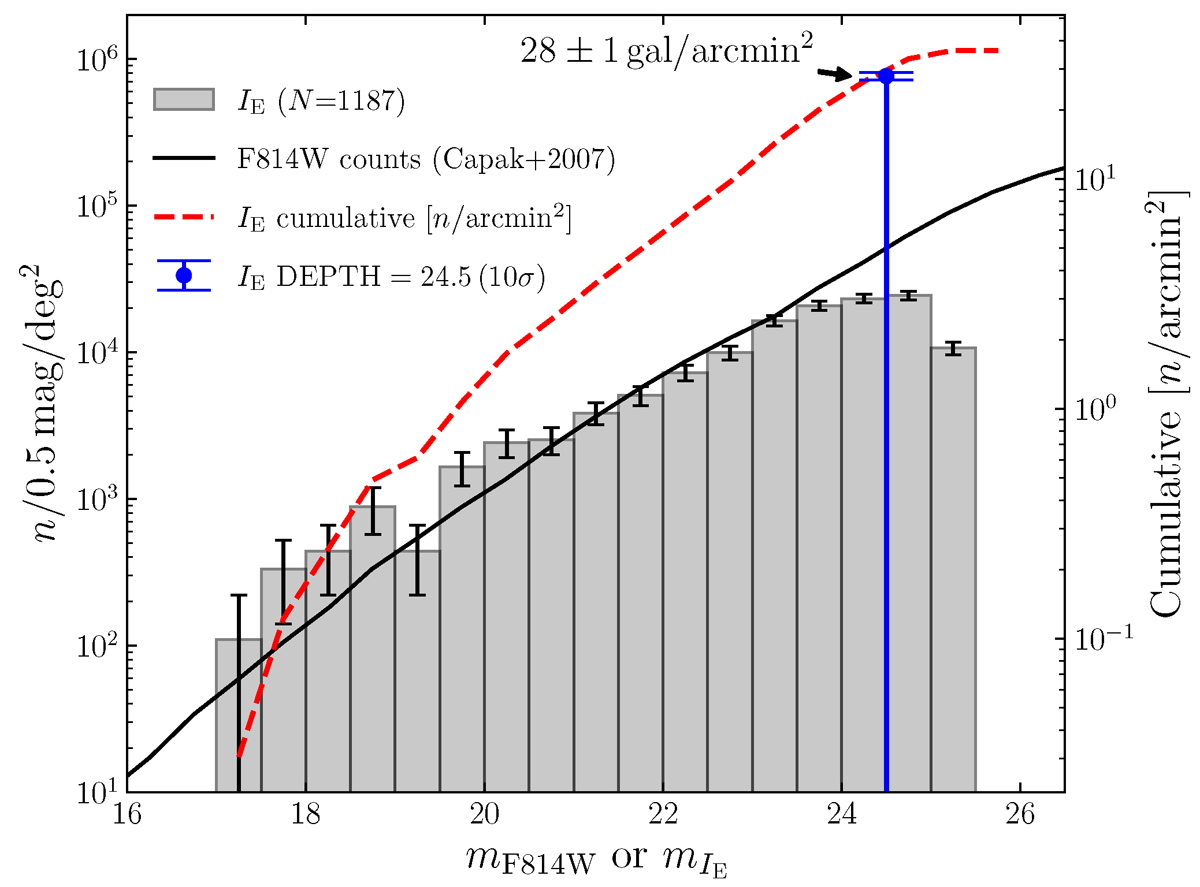
Galaxy number counts from Euclid observations. The galaxy differential number counts derived from the simulated Euclid observations in the IE band of the six HFF parallel fields are shown by the grey histogram with error bars. For comparison, those measured from HST observations (Capak et al. 2007) are indicated by the black solid line. The vertical blue line marks the limiting magnitude in the IE band (24.5 at 10 σ). The cumulative number of galaxies per arcmin2 is shown by the red dashed line. We estimate the number counts from a total area of ∼32.67 arcmin2. We quote the number of galaxies per arcmin2 at the limiting magnitude at the top of the blue vertical line.
Current usage metrics show cumulative count of Article Views (full-text article views including HTML views, PDF and ePub downloads, according to the available data) and Abstracts Views on Vision4Press platform.
Data correspond to usage on the plateform after 2015. The current usage metrics is available 48-96 hours after online publication and is updated daily on week days.
Initial download of the metrics may take a while.