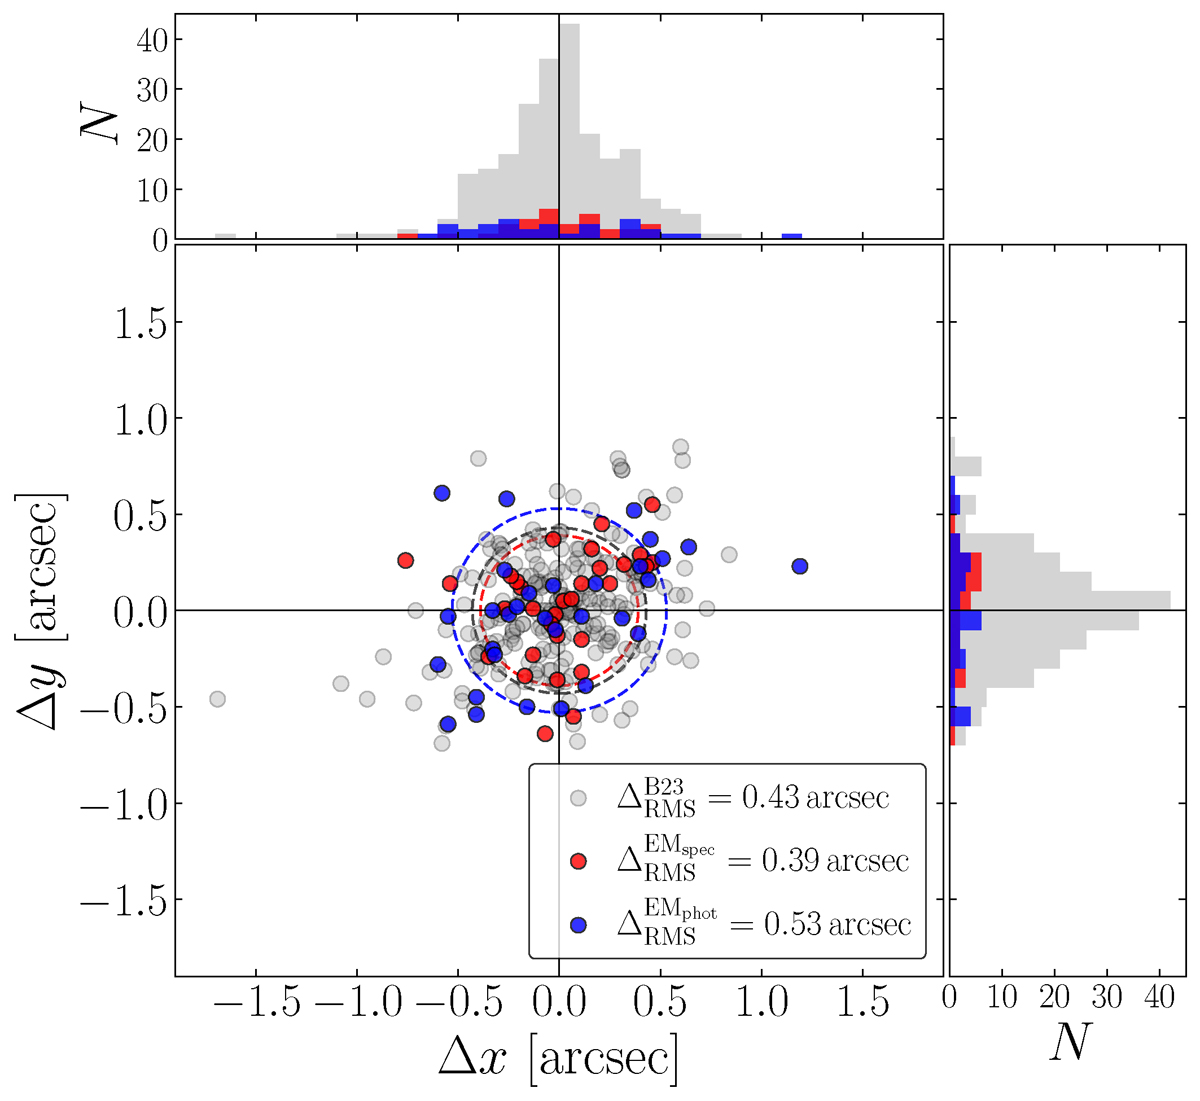
Fig. 7.
Download original image
Displacements in the sky plane between the observed and model-predicted positions of the multiple images. We show the results for the models EMspec and EMphot in red and blue, respectively. For comparison, we also show the results obtained by B23 in grey. The histograms show the distribution of the displacements along the two directions. While the B23 model is based on 237 multiple images from 88 background sources, the EMspec and EMphot models are constructed using constraints from 31 multiple images of 12 sources. We quantify the accuracy of each model in terms of the ΔRMS (see Sect. 6), as reported in the legend. This accuracy also determines the radii of the coloured dashed circles in the figure.
Current usage metrics show cumulative count of Article Views (full-text article views including HTML views, PDF and ePub downloads, according to the available data) and Abstracts Views on Vision4Press platform.
Data correspond to usage on the plateform after 2015. The current usage metrics is available 48-96 hours after online publication and is updated daily on week days.
Initial download of the metrics may take a while.