Fig. 1
Download original image
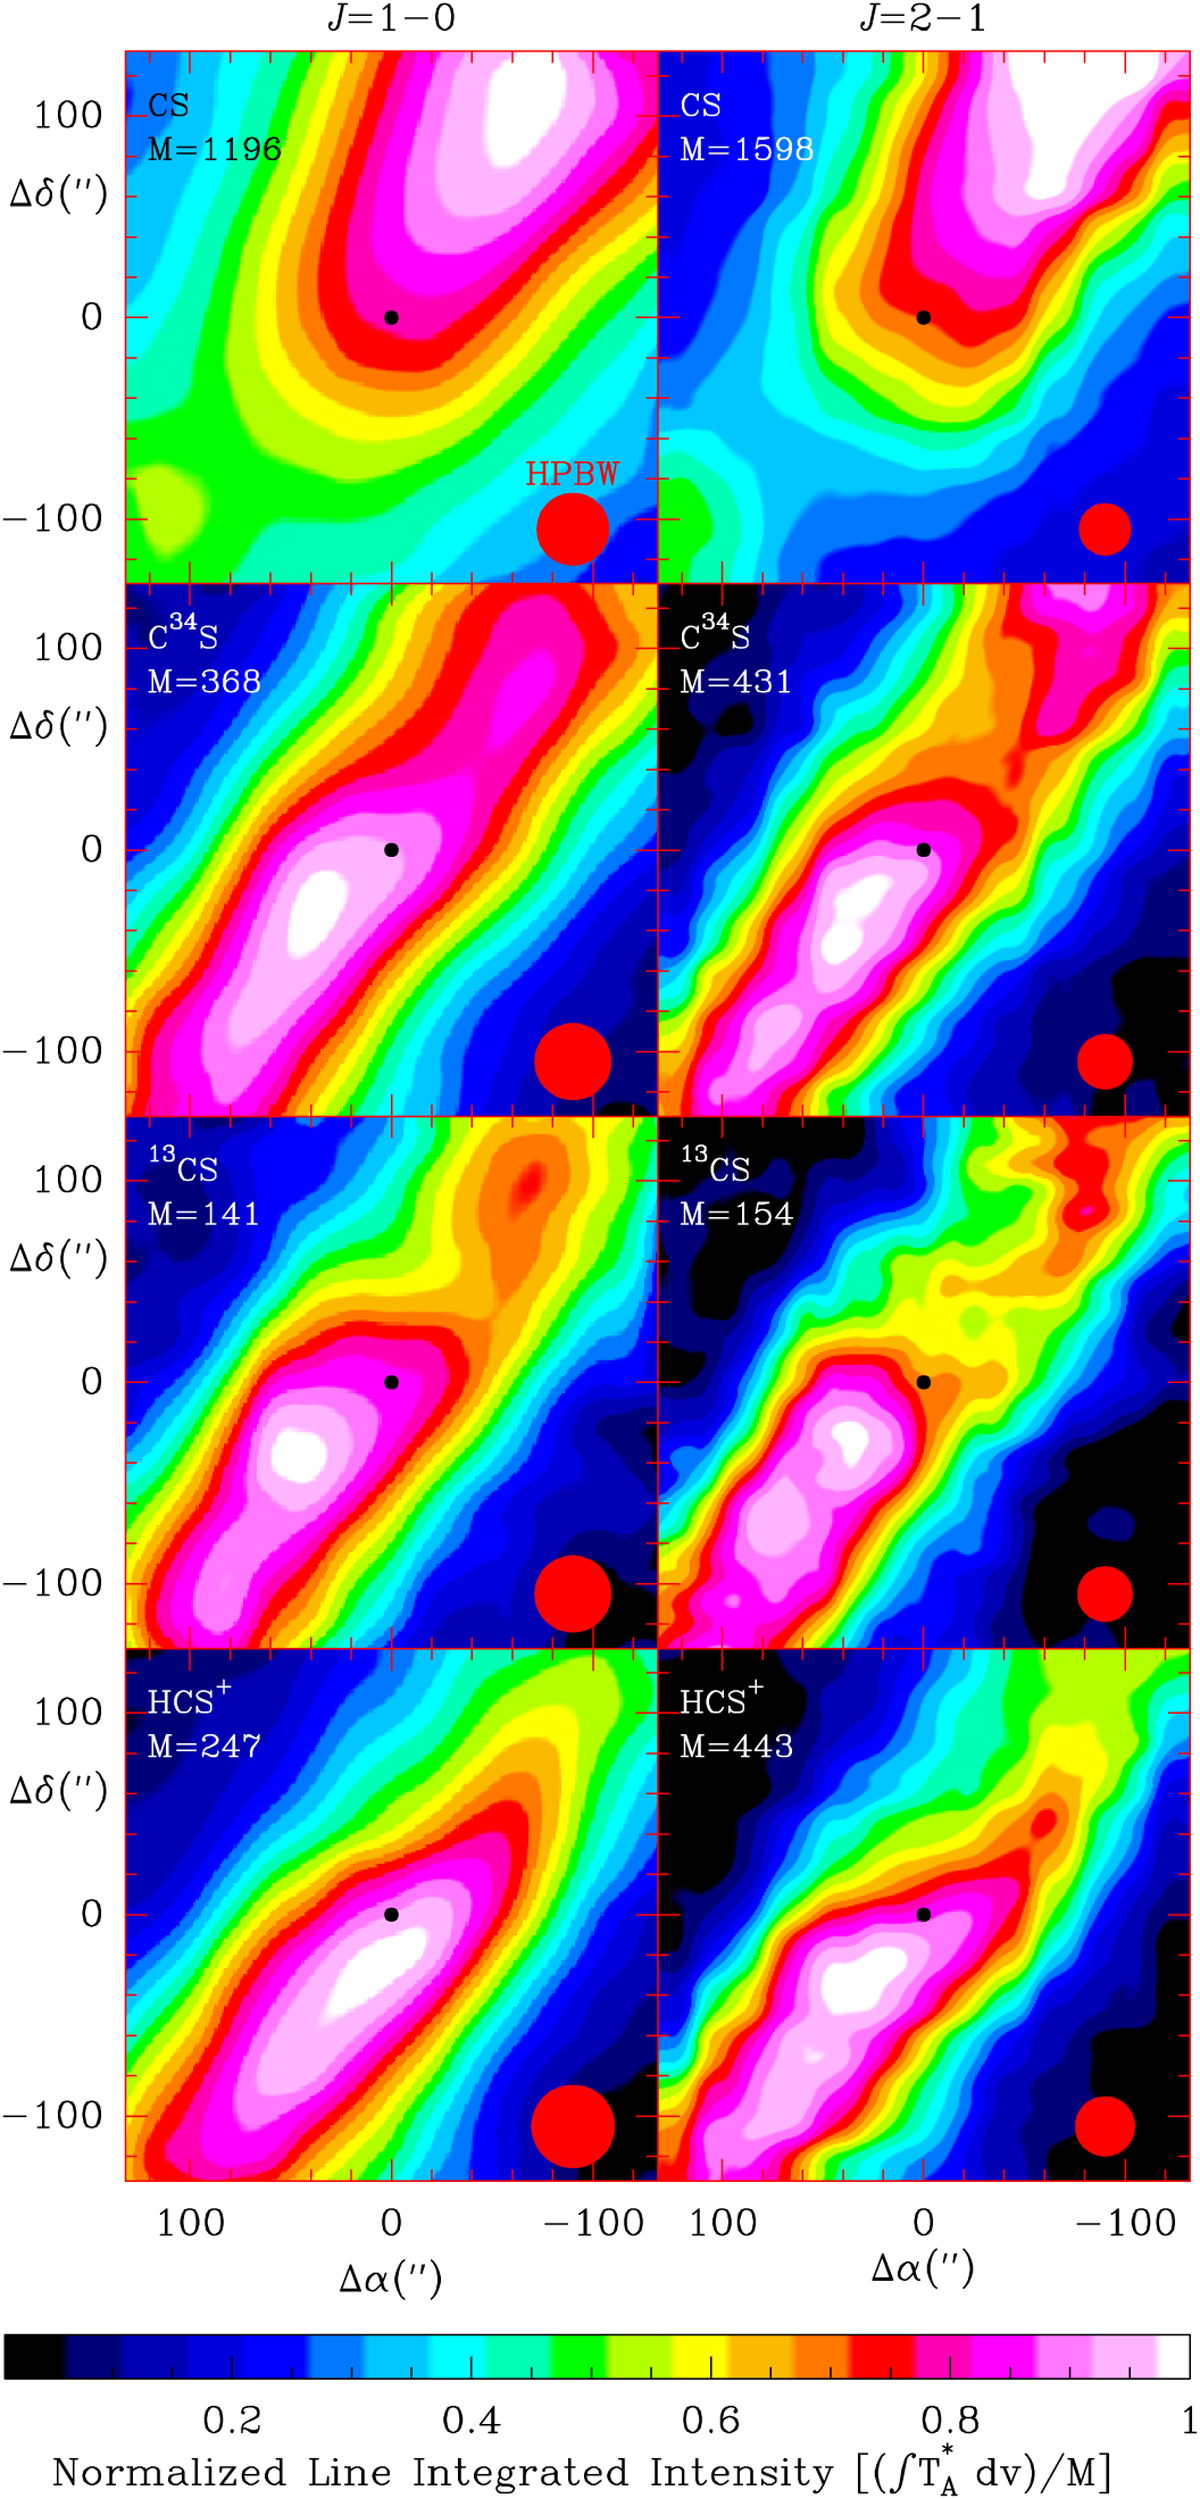
Spatial distribution over a region of 264″×264″ of the integrated-intensity emission of the J=1–0 and J=2–1 transitions (left and right panels, respectively) of CS, C34S, 13CS, and HCS+ (from top to bottom). For each map, the integrated-line emission has been normalized to its maximum value (M). The value of M in mK km s−1 is indicated below the name of the molecule at the top left side of each panel. The HPBW of the telescope for each transition is indicated by the red circle. The central position of the map, corresponding to TMC-1(CP), is indicated by a black dot.
Current usage metrics show cumulative count of Article Views (full-text article views including HTML views, PDF and ePub downloads, according to the available data) and Abstracts Views on Vision4Press platform.
Data correspond to usage on the plateform after 2015. The current usage metrics is available 48-96 hours after online publication and is updated daily on week days.
Initial download of the metrics may take a while.