Fig. 3
Download original image
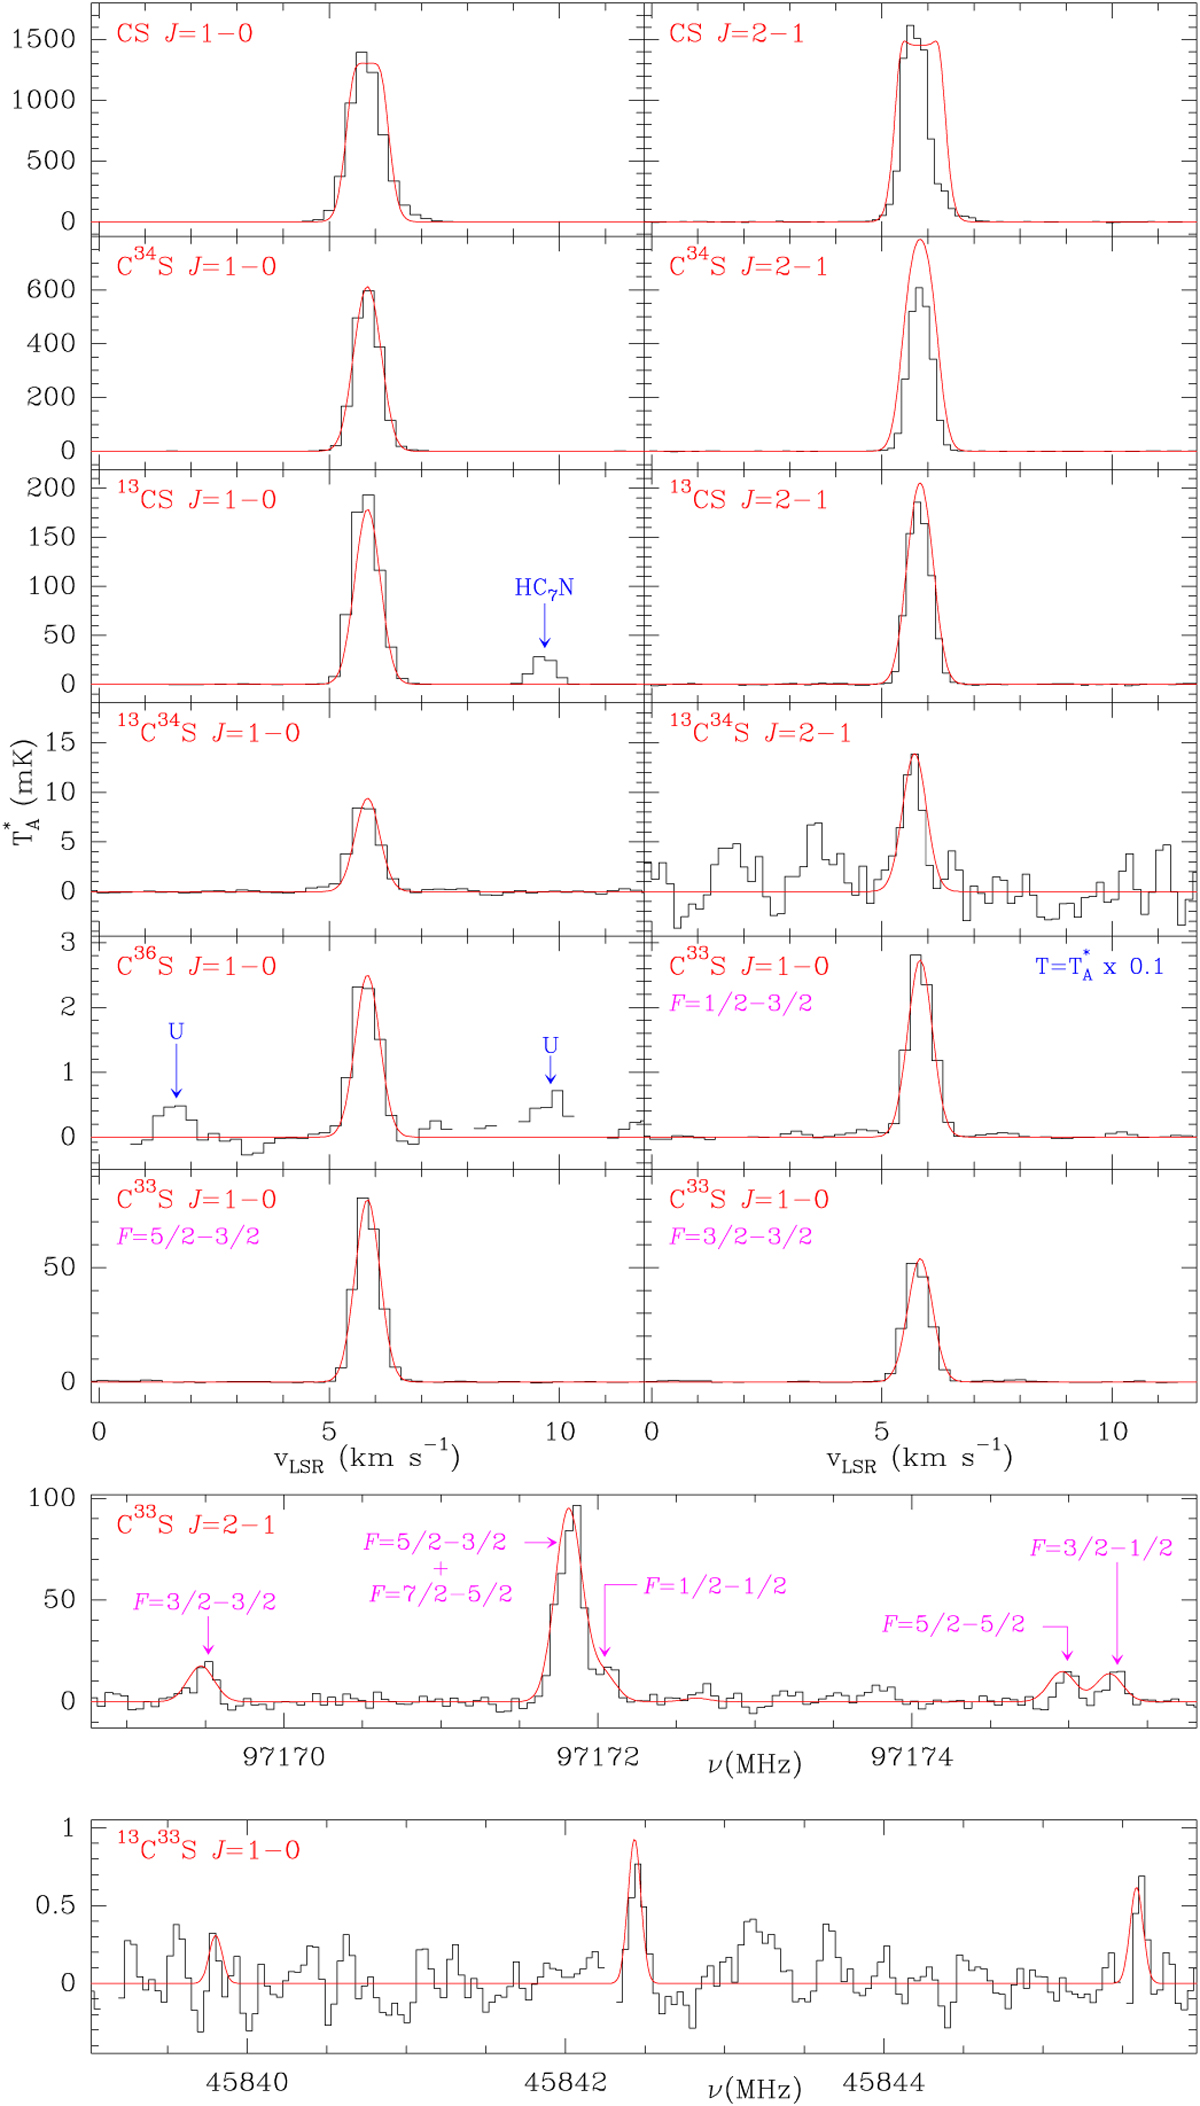
Observed J = 1–0 and 2–1 lines of CS and its isotopologues 13CS, C34S, C33S, and 13C34S toward TMC-1. For C36S and 13C33S, only the J=1–0 line was detected. The abscissa corresponds to the local standard of rest velocity of the lines adopting the rest frequencies given in Table B.1. In the two bottom panel, however, the abscissa corresponds to the rest frequency. The ordinate corresponds to the antenna temperature corrected for atmospheric and telescope losses in mK. The derived line parameters for the observed lines are given in Table B.1. The synthetic spectra (red line) are derived for the column densities shown in Table 1 and the LVG model described in Sections 3 and 4.1. For CS, a two-layer component model is used (see Section 4.1). Negative features appearing in the folding of the frequency switching data are blanked in all the figures. The observed spectrum of the hyperfine component J=1–0, F=1/2–3/2 of C33S was multiplied by 0.1.
Current usage metrics show cumulative count of Article Views (full-text article views including HTML views, PDF and ePub downloads, according to the available data) and Abstracts Views on Vision4Press platform.
Data correspond to usage on the plateform after 2015. The current usage metrics is available 48-96 hours after online publication and is updated daily on week days.
Initial download of the metrics may take a while.