Fig. 2.
Download original image
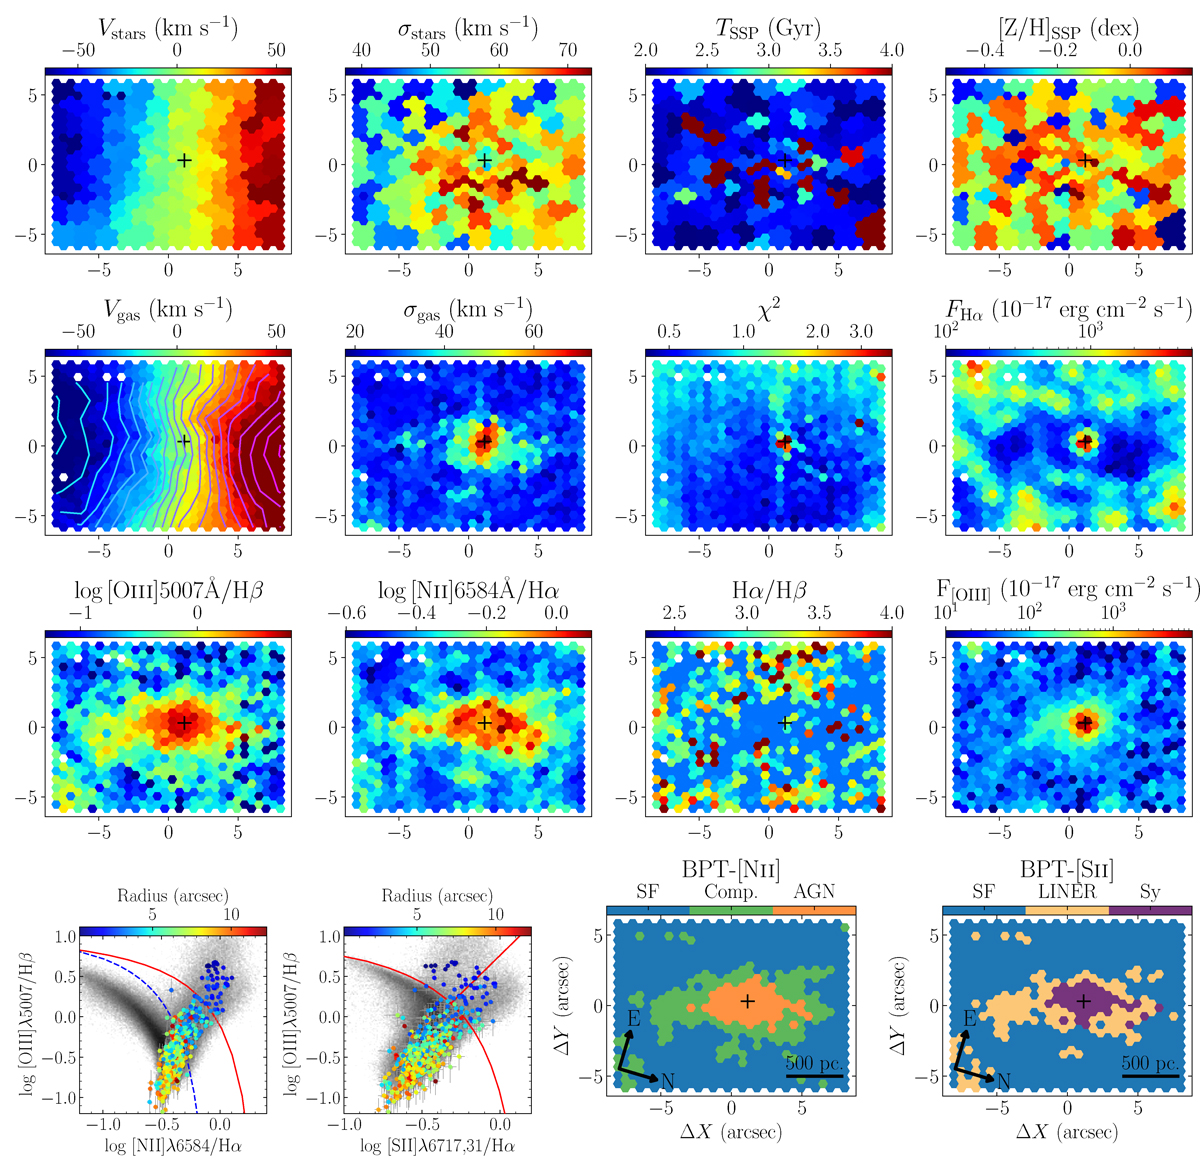
Analysis results from the NGC 3259 Binospec IFU datacube. First (top) row: 1. Stellar population velocity (Vstars). 2. Stellar population velocity dispersion (σstars). 3. Simple stellar population age (TSSP). 4. SSP ([Z/H]SSP) metallicity. Second row: 1. Hα emission line velocity (Vgas). 2. Hα emission line velocity dispersion (σgas); 3. Reduced χ2 in each spaxel. 4. Hα emission line flux. Third row: emission line ratios: 1. [O III]/Hβ. 2. [N II]/Hα; 3. Balmer decrement for the narrow-line component, Hα/Hβ. 4. [O III] emission line flux. Fourth (bottom) row: BPT diagrams (1 & 2) with the position of each spaxel with color-coded inclination-corrected distance from the galaxy center, underlying grey points represent position of galaxies from RCSED (Chilingarian et al. 2017). 3–4: Color-coded classification of spaxels according to their position on the BPT diagram. In each panel (rows 1–3) we show the center of the broad-line point source with a black cross.
Current usage metrics show cumulative count of Article Views (full-text article views including HTML views, PDF and ePub downloads, according to the available data) and Abstracts Views on Vision4Press platform.
Data correspond to usage on the plateform after 2015. The current usage metrics is available 48-96 hours after online publication and is updated daily on week days.
Initial download of the metrics may take a while.