| Issue |
A&A
Volume 702, October 2025
|
|
|---|---|---|
| Article Number | A42 | |
| Number of page(s) | 18 | |
| Section | Extragalactic astronomy | |
| DOI | https://doi.org/10.1051/0004-6361/202554130 | |
| Published online | 01 October 2025 | |
NGC 3259: A signal for an untapped population of slowly accreting intermediate-mass black holes
1
Université Paris Cite, CNRS, Astroparticule et Cosmologie, F-75013 Paris, France
2
Sternberg Astronomical Institute, M.V. Lomonosov Moscow State University, 13 Universitetsky Prospect, 119992 Moscow, Russia
3
Center for Astrophysics | Harvard & Smithsonian, 60 Garden St., Cambridge, MA 02138, USA
4
Observatoire de Paris, LUX, Collège de France, CNRS, PSL University, Sorbonne University, 75014 Paris, France
5
Instituto de Alta Investigación, Universidad de Tarapacá, Casilla 7D, Arica, Chile
6
European Southern Observatory, Karl Schwarzschildstrasse 2, 85748 Garching bei München, Germany
7
New York University Abu Dhabi, P.O. Box 129188 Abu Dhabi, UAE
8
Center for Astrophysics and Space Science (CASS), New York University Abu Dhabi, P.O. Box 129188 Abu Dhabi, UAE
9
Faculty of Physics and Earth System Sciences, Leipzig University, Linnestraße 5, 04103 Leipzig, Germany
10
Centre for Astrophysics and Supercomputing, Swinburne University of Technology, Hawthorn, Victoria 3122, Australia
⋆ Corresponding author.
Received:
13
February
2025
Accepted:
25
June
2025
Abstract
Low-mass active galactic nuclei (AGNs) can provide important constraints on the formation and evolution of supermassive black holes (SMBHs), which stands as a central challenge in modern cosmology. To date, only small samples of intermediate-mass black holes (IMBHs, MBH < 105 M⊙) and “lesser” SMBHs (LSMBHs, MBH < 106 M⊙) have been identified. Our present study of NGC 3259 at D = 27 Mpc with the Binospec integral field unit (IFU) spectrograph complemented with Keck Echelle Spectrograph and Imager observations demonstrates the strong capability and necessity for spectroscopic follow-up studies. NGC 3259 hosts a black hole (BH) with a mass of MBH = (2.0 − 4.9)×105 M⊙, inferred from multi-epoch spectroscopic data, which is accreting at 1% of the Eddington limit, as suggested by the analysis of archival XMM-Newton observations. It is the second-nearest broad-line low-mass AGN after the archetypal galaxy NGC 4395. The spectroscopic data reveal a variable broad Hα profile likely resulting from asymmetrically distributed broad-line region (BLR) clouds or BLR outflow events. X-ray observations and the absence of an optical power-law continuum suggest partial obscuration of the accretion disk and hot corona by a dust torus. We estimated that Sloan Digital Sky Survey (SDSS) observations would only have the capacity to detect similar objects up to D = 35 Mpc. A detailed photometric analysis of NGC 3259 using HST images provides a central spheroid stellar mass estimate that is 20 times lower than expected, based on the MBH − Msph* relation, making this galaxy a significant outlier. This discrepancy suggests divergent growth pathways for the central BH and spheroid, potentially influenced by the potential presence of a bar in the galaxy. Finally, we demonstrate that the DESI and 4MOST surveys will detect low-accretion-rate IMBHs and LSMBHs, while the sensitivity of future X-ray instruments (such as AXIS and Athena) will secure their classification.
Key words: galaxies: active / galaxies: bulges / galaxies: individual: NGC 3259 / galaxies: nuclei / galaxies: Seyfert
© The Authors 2025
 Open Access article, published by EDP Sciences, under the terms of the Creative Commons Attribution License (https://creativecommons.org/licenses/by/4.0), which permits unrestricted use, distribution, and reproduction in any medium, provided the original work is properly cited.
This article is published in open access under the Subscribe to Open model. This email address is being protected from spambots. You need JavaScript enabled to view it. to support open access publication.
1. Introduction
Supermassive black holes (SMBHs) are thought to grow through two main channels: gas accretion (Volonteri 2012) and mergers (Merritt & Milosavljević 2005). The latter channel establishes a scaling relation between the galaxy bulge mass (central spheroid) and the central black hole (BH) mass (Msph* − MBH), which reflects the coevolution of these two components (Kormendy & Ho 2013). Typically, SMBHs and massive galaxies follow the scaling relation between Msph* and MBH, indicating that galaxy mergers are the dominant growth mechanism for SMBHs in this mass range (Graham & Scott 2015; Graham et al. 2019; Graham & Soria 2019; Graham & Sahu 2023; Graham 2024). In low mass and some gas-rich galaxies (spirals and lenticulars built by major wet mergers), gas accretion likely plays a more significant role in black hole growth. The accretion changes the coevolution of the BH and the central spheroid. Lower-mass supermassive black holes (lesser SMBH; LSMBHs, 2 × 10⁵ < MBH < 106 M⊙) and intermediate-mass black holes (IMBHs, 100 < MBH < 2 × 10⁵ M⊙) in general follow the SMBH Msph* − MBH relation (Greene & Ho 2007; Chilingarian et al. 2018; Nguyen et al. 2018, 2019). Bulgeless galaxies like NGC 4395 are exceptions.
The selection biases for the current LSMBH and IMBH samples are poorly understood. Most of the known type-I AGN powered by bona fide IMBHs with X-ray counterparts have high accretion rates and significant luminosities in broad Hα and X-ray emission, enhancing their detectability. A population of low-accretion-rate LSMBHs may be missing from current samples. Observations of higher mass SMBHs indicate that the volume density of low-Eddington-ratio (λ ∼ 10−2) SMBHs is 100−10 000 times higher than the volume density of λ = 1 (Weigel et al. 2017; Ananna et al. 2022) SMBHs. If LSMBHs and IMBHs follow an Eddington ratio distribution similar to that of SMBHs, a substantial population of these lower mass BHs likely remains undetected because of observational limitations.
Central BH growth may proceed via different processes in low-mass AGNs with lower accretion rates than in SMBH-powered rapidly accreting quasars, which affect both the growth of the central BH and the properties of a central spheroid. For example, in the absence of major mergers, bars that may funnel gas toward the galaxy center may predominantly drive BH growth through gas accretion. This inflowing gas can fuel star formation in a pseudo-bulge (Fanali et al. 2015). After the gas within the inner Lindblad resonance is fully depleted, low accretion rates may prevent the detection of these low-mass AGNs. The pseudo-bulge may not have undergone the same coevolutionary processes as the central BH (and the classical merger-built bulge) and may not follow the Msph* − MBH relation observed for SMBHs.
NGC 3259 with an AGN powered by a slowly accreting LSMBH with MBH = (2.0 − 4.9)×105 M⊙ (estimated from our multi-epoch spectroscopic dataset), provides an opportunity to explore the detectability of LSMBHs and IMBHs with low accretion rates. The low-mass end of the BH mass function constrains formation scenarios of high-redshift SMBHs. Theory proposes three primary pathways for SMBH seed growth: (i) through collisions and core collapse in star clusters containing Population III stars (Portegies Zwart et al. 2004), (ii) rapid infall and direct collapse of gas clouds (Loeb & Rasio 1994; Begelman et al. 2006); and (iii) gravitational runaway in central dense star clusters (Quinlan & Shapiro 1990; Lee 1993). The second mechanism predicts a gap in the present-day black hole mass function unlike the first, allowing us to differentiate between these channels. The contribution of the third channel is much harder to constrain from present-day observations of the IMBH population.
We propose a new term ‘Lesser SMBH’ (LSMBH) for the MBH range 105 − 106 M⊙ for the following reasons. (i) The extragalactic community currently calls black holes with 102 < MBH < 1 − 2 × 10⁵ M⊙ IMBHs. The term IMBH implies a BH seeding mechanism as well as a mass range. (ii) The term SMBH only defines the mass, while the proposed ‘LSMBH’ is meant to imply a seeding scenario similar to IMBHs.
Originally, the IMBH category included the MBH range between 105 and 106 M⊙ as well (Greene & Ho 2004; Ulvestad et al. 2007; Dewangan et al. 2008; Seth et al. 2010; Kamizasa et al. 2012; Yuan et al. 2014). However, since the mid-2010s, the growing interest in ultra-luminous and hyper-luminous X-ray sources (ULXs and HLXs, respectively) as potential IMBHs has led to a downward revision of the upper IMBH mass limit to 1 − 2 × 10⁵ M⊙ (Mezcua et al. 2013; Godet et al. 2014; Cseh et al. 2015; Chilingarian et al. 2018). Nonetheless, black holes with 105 < MBH < 106 M⊙ remain highly relevant for understanding the SMBH seeding mechanisms in the early Universe (Greene et al. 2020). While IMBHs with MBH < 105 M⊙ mainly constrain light seed models, black holes in the higher 105 − 106 M⊙ range probe medium-weight and heavy seed scenarios (Sassano et al. 2021; Bhowmick et al. 2025).
Current and planned spectroscopic surveys: the Dark Energy Spectroscopic Instrument (DESI; DESI Collaboration 2016) and the 4-metre Multi-Object Spectroscopic Telescope (4MOST; de Jong et al. 2019), will expand spectroscopic samples of galaxies in number, redshift, and spectral resolution compared to the existing SDSS (York et al. 2000), 2dF (Colless et al. 2001) and LAMOST (Zhao et al. 2012) datasets. The newer surveys will enable more systematic studies of AGNs powered by LSMBHs in a cosmological context by providing more complete information about the broad emission line component. These studies will validate SMBH growth channels in the late stages of the Universe and constrain BH seed formation in the early Universe (Di Matteo et al. 2008; Singh et al. 2023; Cammelli et al. 2025). A detailed investigation of selection biases will inform the new surveys.
We adopt ΛCDM cosmology with ΩM = 0.3, ΩΛ = 0.7, h = 0.72 (Riess et al. 2024), and σ8 = 0.8. All magnitudes are presented in the AB system (Oke & Gunn 1983), and all uncertainties are quoted at the 1σ level unless stated otherwise.
The Sloan Digital Sky Survey spectrum1 for NGC 3259 gives a redshift of z = 0.0056 (v = 1678 km s−1, or D = 23.3 Mpc). The redshift-based distance estimate may be inaccurate due to peculiar velocities of up to a few hundreds of km s−1 because NGC 3259 is located in a galaxy group. The Tully-Fisher relation in the Spitzer bands (Tully et al. 2016) yields a distance modulus of (m − M) = 32.63 ± 0.30 mag or D = 33.5 ± 4.3 Mpc. The NAM model2 (Shaya et al. 2017), as implemented in the Cosmicflows-3 distance calculator (Kourkchi et al. 2020), gives a distance to NGC 3259 of 27.0 Mpc, which is the value we adopted for this work. This makes NGC 3259 a host to the second-nearest broad-line AGN powered by a low-mass BH after the archetype galaxy NGC 4395 (Filippenko & Sargent 1989; Ho et al. 1997a,b) located 4.8 Mpc away.
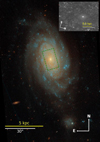 |
Fig. 1. Color image of NGC 3259 produced by combining F435W and F814W HST ACS/WFC images. The green dashed rectangle shows the Binospec IFU field of view and the inset is the portion of the F330W HST ACS/HRC image in the Binospec IFU field of view. |
2. New and archival observations
Our study of NGC 3259 uses archival and recently obtained spectroscopic and imaging datasets. In the following subsections, we describe these observations.
2.1. Hubble Space Telescope spectroscopy
NGC 3259 was observed with the Space Telescope Imaging Spectrograph (STIS, Woodgate et al. 1998) on July 09, 2000 as part of a snapshot program to assess the Msph* − MBH relation for spiral galaxies (HST-SNAP-8228, PI: D. Axon). The observations used a 52 × 0.2 arcsec slit with the G750M grating, providing a wavelength coverage from 6480 to 7058 Å and a spectral resolution of R ∼ 10 000 for a point source. Of the six frames obtained for this target, only two showed a clear trace of the target spectrum and were used for spectral extraction. The total exposure time for the two frames was 860 s. The two fully reduced and calibrated frames, available in the MAST archive, were coadded using a custom cosmic-ray rejection procedure that rejects pixels with flux exceeding that of the second frame by more than 10−15 erg cm−2 s−1 arcsec−2.
NGC 3259 was later observed in the far-ultraviolet (FUV) on October 24, 2011 with the Cosmic Origins Spectrograph (COS, Green et al. 2012) as part of the program titled “Low-Mass Black Holes and CIV in Low-Luminosity AGN” (HST-GO-12557, PI: K. Gultekin). The 2324 s observation used a circular d = 2.5 arcsec aperture and the G160M grating with a 1623 Å central wavelength. This configuration provides wavelength coverage from 1432 to 1798 Å with a gap between 1606 and 1625 Å at a spectral resolving power of R = 13 000 − 20 000. We downloaded an extracted, fully reduced flux calibrated one-dimensional spectrum from the MAST archive.
2.2. Integral field unit spectroscopy with Binospec/MMT
We observed NGC 3259 using the Binospec spectrograph (Fabricant et al. 2019) at the 6.5-m MMT at Mt. Hopkins, Arizona, USA in IFU mode (Fabricant et al. 2025). The nucleus of NGC 3259 was centered in the 16 × 12 arcsec2 field of view sampled by 0.68 arcsec diameter hexagonal spaxels3 aligned with the major axis of the galaxy at a position angle (PA) of 16° (Fig. 1). The Binospec IFU includes dedicated sky fibers for accurate background subtraction 5 arcmin away from the source. To perform the absolute flux calibration and correct for atmospheric absorption, we also observed the A0V-type star HIP 56147 (V = 7.39 mag) on the same night at a similar airmass.
NGC 3259 was observed on January 15, 2024 during the science verification observing run of Binospec-IFU, with a total integration time of 45 min split into individual 15 min long exposures. We used a 600 g mm−1 grating, which provided a spectral resolving power of R ∼ 4000 − 5000 in the wavelength range 4710−7170 Å. These data were collected under good transparency conditions during gray time, with seeing of 0.8−1.1 arcsec. observations. Prior to the observations we obtained arc lamp and flat field exposures for a wavelength calibration and sensitivity correction.
The spectra were reduced using a version of the Binospec pipeline (Kansky et al. 2019) updated for the reduction of IFU data (Fabricant et al. 2025). The pipeline produces a flux-calibrated, sky-subtracted, rectified, and wavelength-calibrated 3D datacube with associated flux and error values. The wavelength axis is linearly sampled with a step size of 0.6 Å pix−1. We used the extracted spectra of an A0V star to construct a telluric absorption model.
For the absolute flux calibration we divided a resampled and smoothed Binospec spectrum of HIP 56147 by the low resolution Gaia DR3 BP/RP spectrum of the same star (Gaia Collaboration 2023) to derive a polynomial sensitivity curve.
2.3. Keck ESI spectroscopy
NGC 3259 was observed with the Echellette Spectrograph and Imager (ESI, Sheinis et al. 2002) at the 10-m Keck-II telescope at Mauna Kea, Hawaii, USA two times. First, on February 14/15, 2004 under dark sky conditions and 0.9 arcsec seeing (Keck program ID C31E, Barth et al. 2008). Second, on March 27/28, 2023 under dark sky conditions with intermittent thin cirrus clouds and 1 arcsec seeing (NOIRLab program ID 2023A-914712; Keck program ID R100; P.I.: IC). All observations used the echelle mode with a 0.75-arcsec-wide and 20 arscec-long slit providing the wavelength coverage of 3927−10 400 Å and a mean spectral resolving power R ≈ 8200. For the 2023 dataset, we obtained three equal exposures with a total integration time of 1800 s. The 2004 observation was a single 1800 s-long exposure. For sky background subtraction in 2023 dataset, we used two 300 s-long exposures 120 arcsec West of the galaxy center, one before and one after the sequence of science exposures. For the 2004 observations, we used two 1800 s-long exposures of unresolved sources obtained before and after NGC 3259. In 2023, for absolute flux calibration and telluric absorption correction, we observed the A0V star HD 71906 (V = 6.17 mag) at a similar airmass to the science target 30 min prior to the science observations. For the 2004 archival dataset we used an observation of the star BD+26 595 (G8III; V = 8.36 mag). We performed wavelength calibration using day-time spectra of Hg+Ne, Xe, and Cu arc lamps.
Spectra were reduced using our ESI pipeline4 (Chilingarian 2020). The pipeline generates flux-calibrated, sky-subtracted, rectified, wavelength-calibrated, telluric-corrected, and coadded 2D frames with flux and flux uncertainty maps. The weights of the two sky frames were manually adjusted to optimize the residuals of the night sky emission lines. The reduced 2D spectrum has a linearly spaced wavelength grid with a step size of 0.2 Å pix−1. We corrected for light loss at the slit using the spectra of telluric stars mentioned earlier.
Our absolute flux calibration procedure is similar to that for Binospec data (Section 2.2). However, due to the absence of Gaia calibration star spectra, we used an A0V and G8III (Te = 4400; log g = 2.10; [Fe/H]= − 0.8 dex) synthetic template spectra from the PHOENIX library (Husser et al. 2013). We normalized the synthetic spectra with V-band magnitudes reported in SIMBAD. The estimated absolute flux calibration accuracy is ∼15% due to seeing variations and passing cirrus clouds.
2.4. Isaac Newton Telescope IDS spectroscopy
NGC 3259 was observed on February 10, 2014 with the Intermediate Dispersion Spectrograph (IDS) at the 2.5-m Isaac Newton Telescope (INT) at the Roque de los Muchachos Observatory in the Canary Islands, Spain (Aouad et al. 2020). The 1.5 arcsec-wide, 3 arcmin-long slit with the R1200Y grating provided spectral resolving power R ∼ 5000. The total exposure time was 3600 s split in three equal exposures. We retrieved these science and calibration exposures as well as exposures for the calibration star from the INT archive5. We reduced IDS spectra using our own generic long-slit data reduction pipeline6, briefly described in Chilingarian & Asa’d (2018). The pipeline delivers flux- and wavelength-calibrated, rectified, slit-illumination corrected, sky-subtracted 2D long-slit spectra with the corresponding flux uncertainties.
2.5. Hubble Space Telescope images
NGC 3259 was observed on June 09, 2002 with the ACS camera onboard the Hubble Space Telescope (HST) as part of a galaxy bulge formation program (Proposal ID: 9395, PI: M. Carollo). Images were obtained in three filters: F330W, F435W, and F814W, with the F330W dataset taken in ACS/HRC mode (Fig. 1). The total exposure times for the F330W and F814W filters are 2760 seconds and 1200 seconds, respectively. We used publicly available datasets provided by the Hubble Legacy Archive (HLA)7.
2.6. XMM-Newton X-ray observations
NGC 3259 was observed twice with XMM-Newton: once in 2006 (PI: A. Barth; exposure time: 24 ks, Date: 2006-05-06, Target name: 103234.85+650227.9, Obs. ID: 0400570401) and again in 2011 (PI: E. Cackett; exposure time: 22 ks, Date: 2011-10-10, Target name: SDSSJ103234, Obs. ID: 0674810701), using the MOS and PN instruments. We retrieved the two datasets from the XMM-Newton Science Archive (XSA) and performed data reduction following the procedures outlined in XMM SAS (Gabriel et al. 2004). The key steps included: (i) Generation of calibrated and concatenated event lists using the EMPROC and EPPROC utilities8; (ii) Event list cleaning to exclude periods of high background by applying a count rate filtering threshold9. In the calibrated event lists, NGC 3259 shows a strong X-ray detection at the position of RA = 10:32:34.78 and Dec = +65:02:26.7. These coordinates match the optical nuclear point source position in the HST images with a position error of 0.48 arcsec, within the 3σ uncertainties of the XMM detection. After identifying the X-ray counterpart, we extracted spectra in 13.4 arcsec radius circular aperture. Background spectra were extracted from circular regions in each dataset, chosen to avoid detector gaps and bad pixel columns. We combined the extracted spectra from the EPIC-pn, EPIC-MOS1, and EPIC-MOS2 detectors, using the EPICSPECCOMBINE routine to achieve a higher signal-to-noise ratio for each exposure.
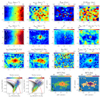 |
Fig. 2. Analysis results from the NGC 3259 Binospec IFU datacube. First (top) row: 1. Stellar population velocity (Vstars). 2. Stellar population velocity dispersion (σstars). 3. Simple stellar population age (TSSP). 4. SSP ([Z/H]SSP) metallicity. Second row: 1. Hα emission line velocity (Vgas). 2. Hα emission line velocity dispersion (σgas); 3. Reduced χ2 in each spaxel. 4. Hα emission line flux. Third row: emission line ratios: 1. [O III]/Hβ. 2. [N II]/Hα; 3. Balmer decrement for the narrow-line component, Hα/Hβ. 4. [O III] emission line flux. Fourth (bottom) row: BPT diagrams (1 & 2) with the position of each spaxel with color-coded inclination-corrected distance from the galaxy center, underlying grey points represent position of galaxies from RCSED (Chilingarian et al. 2017). 3–4: Color-coded classification of spaxels according to their position on the BPT diagram. In each panel (rows 1–3) we show the center of the broad-line point source with a black cross. |
3. Data analysis and results
3.1. Full spectral fitting with emission lines
We applied full spectral fitting to the spectroscopic datasets for NGC 3259 using the NBURSTS IDL package (Chilingarian et al. 2007a,b). This package simultaneously models the stellar population continuum and emission lines from line-of-sight velocity distributions, LOSVDs. The ESI 1D spectrum was modeled using X-shooter simple stellar population (SSP) models (Verro et al. 2022) with a spectral resolution of R ∼ 10 000. This procedure allows estimates of stellar velocity dispersions down to 20 km s−1 (Chilingarian & Grishin 2020). Our model includes a 15th degree polynomial multiplicative continuum. The additive continuum from an AGN was modeled with a second-degree polynomial.
For the Binospec datacube, we optimally extracted a 1D spectrum using a 2D Gaussian profile in the spectral slices for the [O III] emission line as extraction weights (Horne 1986). This 1D spectrum was then modeled similarly, with second-degree additive and a 15th-degree multiplicative continua. To obtain reliable values of the broad-line component parameters it is necessary to extract reliable measurements of broad emission line components from the datacube. Extracting a spectrum within an aperture or using optimal extraction increases the contribution from the host galaxy, while a spectrum from a single central spaxel does not contain the full broad-line component flux. We analyze the emission spectra from 42 spatial elements within a radius of 2 arcsec from the galaxy center. We represent the broad component as a 3D Gaussian with two spatial coordinates (essentially a point spread function) and a spectral coordinate. In Appendix A, we provide details on the precise modeling of the 2D Gaussian for the IFU data. Each element contains a set of Gaussian spectral lines that describe the narrow-line component. This spectral decomposition maximizes the broad-line contribution while minimizing the limitations of the 1D optimal extraction. Analysis of emission line ratios (Baldwin et al. 1981) shows that the dominant excitation mechanism in the central 3−4 arcsec is AGN (Fig. 2), while star formation dominates in the outer parts.
We derived maps of stellar population properties, gas kinematics, and emission line intensities (Fig. 2) from the Binospec IFU data. We applied Voronoi 2D binning (Cappellari & Copin 2003) to achieve a S/N of 10 and modeled the resulting spectra with X-shooter stellar population templates (Verro et al. 2022) fitting emission lines simultaneously with stellar population templates. To extract gas kinematics (velocity and velocity dispersion) and line intensities from individual spaxels, we subtracted the underlying stellar population continuum using the best-fit stellar population models obtained in the Voronoi bins. For each spaxel, we subtracted the corresponding bin’s stellar population template, multiplied by a third-degree multiplicative polynomial continuum derived from fitting the spaxel spectrum with the template.
The limited depth of the STIS dataset does not allow for the detection of the stellar continuum, thus, these data were used only to model the emission lines. The 0.2 arcsec-wide slit used for STIS observations is much wider than the PSF FWHM, which means that the spectral resolution is primarily defined by the photometric profile of the source. Therefore, we performed the full spectral fitting of this dataset without convolving the model with the line spread function (LSF). We converted fluxes from surface brightness to total flux for point sources using the coefficient provided in the DIFF2PT field of the FITS header.
Both the narrow- and broad-line components in the spectroscopic datasets exhibit significant asymmetries and symmetric deviations from pure Gaussian, prompting the inclusion of additional Gaussian-Hermite (GH) terms in the modeled LOSVDs. For the STIS dataset, a proper description of the broad Hα shape, including the blue wing, was achieved only with the sixth-degree GH. The reduced χd.o.f.2 for the modeled STIS dataset is 1.035 for the fourth-degree GH, but it decreases to 1.032 for sixth-degree GH (Δχ2 = 3.9). A sixth-degree GH also adequately describes the outer parts of the broad-line component in the ESI dataset (χd.o.f.2 = 0.454 compared to 0.476 for a pure Gaussian; Δχ2 = 420). The Binospec data are well fit with a fourth-degree GH.
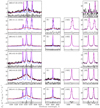 |
Fig. 3. Results of the full spectral fitting of the -epoch dataset for NGC 3259. In each row: Emission line decomposition for the Hα+[NII], Hβ, [OIII], and [SII] regions. Colors coding is as follows: black is the data, blue is the narrow-line components, red is the broad-line component, and magenta is the total model of the emission lines. Residuals and uncertainties are shown in gray. The left panels maintain the same flux scale to emphasize the broad-line variability. |
The resulting values of the highest order GH coefficients from the STIS (h6) and Binospec (h4) spectra (approximately 0.1) confirm the pronounced deviations of the broad-line component from a Gaussian. Although the full χ2 differences are small, they originate from the small part of the spectrum occupied by the broad lines (tens of pixels vs thousands or tens of thousands pixels for the whole spectral range) and are statistically significant.
3.2. Virial BH mass estimate from the broad-line component profile
We used the broad-line Hα profile to estimate the BH mass (Fig. 3), assuming that the broad-line region (BLR) clouds near the BH are virialized. We used the Reines et al. (2013) relation with log ϵ = −0.2 (Grier et al. 2013) to derive BH mass from the Hα FWHM and luminosity. Given the significant asymmetry in the emission line profile, we determined the FWHM of the broad-line component by numerically solving the equation that relates the Gaussian-Hermite emission-line profile to half of its maximum flux.
Our measurements of the emission line fluxes at different epochs show that the broad Hα component varies by a factor of ∼2.5. To rule out possible observational systematics we compared FHα, broad with the measurements of F[OIII], which is seen mainly in the NLR of the AGN. Star formation contributes negligibly to [OIII] flux. F[OIII] emission varies by only 20%, confirming the strong variability of the central source.
Properties of the broad emission line components with statistical uncertainties obtained from the full spectral fitting.
Properties of the stellar populations and narrow emission lines inferred from the full spectral fitting.
Estimates of the BH mass for different epochs ranged from 2.0 to 4.9 × 10⁵ M⊙. Table 1 gives the statistical uncertainties estimated from the model covariance matrix. The high S/N ratios of the spectra result in statistical uncertainties of a few percent. The systematic uncertainties from data reduction, including absolute flux calibration and slit loss correction, are larger. However, the agreement of the four nuclear [OIII] flux estimates within 20% (see above) translates to a MBH difference of only 10% and suggests the physical variability of the broad Hα flux from varying extinction or geometric effects.
The empirical calibration of the virial relation that we used to derive MBH displays a 0.3−0.4 dex scatter estimated by comparing it with other methods to estimate MBH, including reverberation mapping and stellar dynamics (Xiao et al. 2011; Dong et al. 2012). This calibration is a major source of uncertainty for the NGC 3259 MBH estimates. We conclude that the most probable value MBH is between 2.0 × 10⁵ M⊙ and 4.9 × 10⁵ M⊙, with an uncertainty of a factor up to 2.5 that is due to an unknown virial factor and uncertain internal extinction.
3.3. Stellar population properties
The results of the stellar population modeling are presented in Table 2. Our analysis indicates that the central region of NGC 3259 contains an intermediate-age stellar population (SSP-equivalent age tSSP = 2.4 − 4.6 Gyr) and a nearly solar metallicity (−0.15 to +0.07 dex). This age estimate reflects the combined influence of star formation activity in the disk, where young stars are present up to the very center of the galaxy (as seen from the HST images), and the central component, which is predominantly composed of an older, quiescent stellar population.
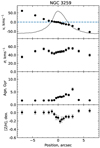 |
Fig. 4. Profiles of the stellar radial velocity (v), velocity dispersion (σ), SSP-equivalent ages and metallicities for NGC 3259 inferred from X-shooter SSP models for the Keck ESI (2023) dataset. The solid gray line in the top panel shows a reconstructed brightness profile along the slit in arbitrary units. |
The high spectral resolution of the ESI and Binospec (Fig. 2) data enabled precise measurements of the velocity dispersion of the central component in the range 49 − 65 km s−1. A clearly visible central dip of a few km s−1 in the velocity dispersion map is likely a signature of a central star cluster that is dynamically colder than the spheroidal component (σ* ≈ 57 km s−1) of NGC 3259. ESI measurements also suggest that the central star cluster is less metal-rich (−0.2 dex) than the spheroid (−0.05…+0.05 dex). More details are given in Fig. 4.
3.4. Isophotal analysis of HST F814W dataset
To measure the structural properties of different components of NGC 3259 we extracted the 1D light profile using the ISOPHOTE.ELLIPSE10 task from the PHOTUTILS Python package. The isophotes were extracted within ellipses with logarithmically scaled semi-major axes and a step size of 0.1. The extracted 1D profile was fit by minimizing the χ2 metric with the LMFIT implementation of the Levenberg-Marquardt algorithm11 (Newville et al. 2016). The model includes five components: four Sérsic profiles and one PSF. The PSF component represents the unresolved AGN, the first (inner) Sérsic component models an extended part of the nuclear star cluster, the second is a central spheroid, and the third and the fourth represent the main disk of the galaxy. For the nuclear star cluster and the main disk, we also tried King (King 1962) and exponential profiles, respectively, but these did not provide a better fit. Throughout the modeling process, we convolved our model with the PSF generated using the TINYTIM tool (Krist et al. 2011) for a G2V-type star spectral energy distribution.
The large number of model parameters may be degenerate. We used the Markov chain Monte Carlo ensemble sample generator (emcee; Goodman & Weare 2010) implemented in LMFIT, running 9000 steps to efficiently explore the parameter space. From this procedure, we selected the values that delivered the highest likelihood as the initial guess for the finely-tuned fitting procedure with the Levenberg-Marquardt algorithm. In Table 3 we provide the results of the decomposition of the 1D photometric profile based on the HST dataset in the F814W band.
Parameters of the photometric components inferred from the modeling of 1D surface brightness profile extracted in the isophote analysis of the F814W imaging dataset for NGC 3259.
The NGC 3259 disk has a complex structure that cannot be adequately described by a single exponential model due to a knee in the surface brightness profile at a radius of ∼2 kpc (Fig. 5). We successfully modeled the disk-dominated data at r > 1 kpc with one exponential disk component and one “lens” component, described by a broad Gaussian (Prieto et al. 2001; Kimbrell et al. 2021).
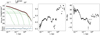 |
Fig. 5. Results of isophotal analysis of HST ACS/WFC images of NGC 3259 in the F814W band. Left panel: Surface brightness (μF814W) profile with the best-fitting model (red line) and its components (green dashed lines); residuals are shown in the bottom sub-panel. Middle panel: Ellipticity (ε) of isophotes. Right panel: Position angle (PA) of isophotes. |
The central spheroid, which can represent the bulge, pseudo-bulge, and/or possibly a bar, was fit with a Sérsic index n = 0.87 ± 0.44, consistent with an exponential profile, and an effective radius12 of 185 ± 15 pc. The spheroid size is consistent with the smallest observed bulges of galaxies (e.g. Bender et al. 1992; Gadotti 2009). It also makes NGC 3259 different from NGC 4395, a bulgeless galaxy (Filippenko & Ho 2003).
3.5. 2D modeling of the nuclear region
To characterize the nuclear star cluster in NGC 3259, we fit a 2D model to the central 1 × 1 arcsec2 (160 × 160 pc2) region containing its nucleus using the F330W HST ACS/HRC dataset (Fig. 6). Our model includes three components: (i) a point source, (ii) an extended Sérsic component for the nuclear star cluster, and (iii) a background component with an exponential profile to fit the diffuse UV emission from the star-forming disk from the rest of the galaxy. The third component has a fixed position and ellipticity. The final model was convolved with the PSF, generated using the TINYTIM utility (Krist et al. 2011) at the position of the nucleus of NGC 3259. A Sérsic profile is widely used to model resolved nuclear star clusters in nearby galaxies (Graham & Spitler 2009; Neumayer et al. 2020; Hoyer et al. 2023).
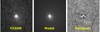 |
Fig. 6. Results of the decomposition of the F330W HST ACS/HRC dataset with GALFIT. Each panel measures 1 × 1 arcsec, north is up, east is to the left. The Sérsic + PSF model is shown. |
Table 4 summarizes our model of the central region of NGC 3259. The extended component has a nearly Gaussian shape (Sérsic index n = 0.6) and an effective radius re = 14 pc. The Sérsic index is lower and the effective radius is larger than typical for nuclear star clusters in nearby galaxies (Hoyer et al. 2023). χd.o.f.2 for this model (3.256) is smaller than for a generalized King model for the extended star cluster (3.279) with a difference in χ2 of Δχ2 = 150. This indicates that the Sérsic profile better describes the data. χd.o.f.2 is substantially higher than 1.0 due to the large residuals in the central part of a galaxy dominated by the imperfectly sampled PSF interpolated by the data reduction pipeline (see Fig. 6).
Properties of central components estimated with Galfit modeling of the F330W HST image.
3.6. Analysis of X-ray XMM-Newton spectra
We used the Sherpa package (Doe et al. 2007) to model the coadded X-ray spectrum. The spectrum cannot be described by a simple power law with dust absorption; χd.o.f.2 for a single power law fit on the XMM-Newton Survey Science Center service13 is 1.87. We modeled the spectrum with two components, each consisting of a power law with absorption (Fig. 7, right). One power law describes a central AGN with varying luminosity but constant spectral index and absorption, and the other describes a constant component, softer power law spectrum with absorption. The first absorption component affects only the embedded AGN. We use the Poisson log-likelihood function (cstat) as the goodness-of-fit metric. To ensure a sufficient S/N, we binned 2006 and 2011 datasets into 20 and 15 channels, respectively. Table 5 summarizes our model for the XMM-Newton X-ray spectra.
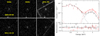 |
Fig. 7. NGC 3259 X-ray data. Left: X-ray images of NGC 3259 from the XMM-Newton MOS1,2 and PN instruments. Right: X-ray spectral models for the XMM-Newton datasets, obtained in 2006 (black) and 2011 (red). The residuals, divided by the error, are shown in the bottom panel. |
Parameters of the best-fitting model for two XMM-Newton X-ray datasets.
Our model for the soft X-ray component has a power law index  with a low absorption column density
  cm−2. This component is likely associated with extended thermal emission from circumnuclear gas, commonly observed in nearby Seyfert 2 galaxies and Compton-thick highly obscured AGNs (Fabbiano & Elvis 2022). The outer part of this region in NGC 3259 shows LINER-type excitation in the IFU data (Fig. 2), also common in AGN sub-kpc scale ionization (Ma et al. 2021; Maksym et al. 2016).
This soft component can also contain some flux contribution from an unresolved population of high-mass X-ray binary stars (Revnivtsev et al. 2007). The luminosity in the 2−10 keV band of F2 − 10 keV = 1.7 × 1038 erg s−1 suggests a star formation rate (SFR) of 0.02 M⊙ yr−1 (Lehmer et al. 2016), which we consider as an upper limit estimate. The Hα flux is strongly suppressed in this area indicating very low if any current star formation.
Our model for the hard X-ray component has a much higher column density NH ∼ (4 − 7)×1022 cm−2, suggesting that the accretion disk (i.e. the central source) and its corona are obscured by dust.
Fig. 7 (right) shows the best-fitting model for both epochs, with the best-fitting parameters listed in Table 5, and the corresponding cstat value of 0.947 (degrees of freedom/datapoints: 24/31). This relatively simple two-component model provides the best fitting quality compared to models with varying Γ (cstat = 0.967, 23/31), varying NH (cstat = 0.982, 23/31), and both varying Γ and NH (cstat = 1.005, 22/31). Given that cstat statistics is distributed similarly to χd.o.f.2, the differences in cstat here are equivalent to Δχ2 ∼ 1.0, which is statistically significant in the case of dozens of data points.
A similar absorbed power-law plus a soft component spectrum is observed in NGC 4395 (Iwasawa et al. 2000). NH absorption in NGC 4395’s hard component varies by almost an order of magnitude between 1022 and 1023.
For the 2006 and 2011 datasets, the unabsorbed fluxes for the hard component are  and
and  10−13 erg cm−2 s−1, respectively. We did not detect any X-ray variability with 3σ confidence.
4. Discussion
4.1. Central BH in NGC 3259
In this section, we review the multi-wavelength evidence supporting our classification of NGC 3259 as a low-luminosity LSMBH, rather than a dusty Seyfert-2 galaxy powered by a considerably more massive BH.
4.1.1. Central source obscuration and geometry
Our analysis of the X-ray data reveals a strongly absorbed hard component, consistent with emission from an obscured AGN accretion disk and hot corona. The obscuration does not affect the soft component, which may be thermal emission from hot gas in the narrow-line region, or may be emitted by a population of X-ray binaries in the disk or a nuclear star cluster.
We do not detect a power-law additive continuum in the optical spectra, also consistent with strong extinction of the central source. However, the optical broad emission lines are not consistent with high extinction. We measure broad-line Balmer decrements of Hα/Hβ = 3.79 ± 0.25 from the ESI data and 4.61 ± 0.71 from the Binospec data, consistent within 1σ. Low flux in the broad Hβ line reduces the accuracy of these measurements.
This discrepancy is not unusual, however. X-ray absorption measured for type-I AGN shows a huge scatter with respect to Balmer decrement based extinction estimates, with X-ray derived neutral hydrogen column densities being factors of ∼0.5 to ≳1000 higher than the Galactic ‘average’ (e.g., Maiolino et al. 2001; Mejía-Restrepo et al. 2022). One explanation for this scatter is that the radiation field of the AGN sublimates dust in its vicinity. The optically thin ionized gas close to the BH will not significantly affect the optical line and continuum emission, but atomic and ionized gas will absorb soft X-rays. A second explanation is that many individual BLR and torus clouds orbiting the SMBH are thought to have a comparable angular size to the X-ray corona, such that they can temporarily occult the X-ray corona for days to years, leading to much higher and time-varying LOS column densities (e.g., Matt et al. 2003; Risaliti et al. 2005).
This extinction discrepancy extends to low-luminosity objects. For example, three low-luminosity AGN (log L2 − 10 keV = 40.5…41.0) from Maiolino et al. (2001) have factors of 3−5 higher optical extinction than one would expect from the NH value measured in the X-ray domain. On the other hand, NGC 4395 has a similar LX and hosts a moderately obscured (NH = 3 × 10²² − 1023 cm−2) AGN, which is highly variable in both luminosity and NH and is powered by an LSMBH, but its FUV-to-optical absorption is very weak: its FUV spectrum has prominent broad lines and continuum, which enabled the CIV-based line–continuum reverberation mapping.
The remaining strong discrepancy between the optical continuum and line extinction could be explained by a nearly edge-on dust torus that heavily obscures the central source but not the BLR. To constrain the extinction towards the BLR, we modeled the COS far-UV spectrum (Fig. 8). The model includes narrow and broad Gaussian components for the CIV doublet. A grid search over a wide range of possible flux and widths of the broad component yielded the best-fitting value FCIV, broad ≈ 3.3 ± 0.2 × 10⁻¹⁶ erg cm−2 s−1. In an unabsorbed AGN the combined flux of the broad components of the CIV doublet is a factor 2 − 3 higher than Hα (Osterbrock & Ferland 2006). For NGC 3259 we therefore expect FC IV ∼ (2 − 4)×10−14 erg cm−2 s−1. Our observations imply ∼5−5.5 mag (100−200 times) absorption, corresponding to a moderate AV = 1.5 − 2.0 mag. This absorption is consistent with the broad line Balmer decrement and the standard extinction curve (R = 3.1). However, this model does not adequately describe the observed high-velocity wings of the broad CIV component because the fit is mostly driven by the central part of the line profile. Our alternative model excludes the central part of the line, which can be affected by self-absorption, because the resonant CIV line is very sensitive to relatively small column densities of gas. This model yields a higher broad line flux, ∼10.5 × 10⁻¹⁶ erg cm−2 s−1, suggesting a lower extinction of 3.2−4 mag (20−40 times). In Fig. A.2 we provide χ2 maps for both variants of the fit.
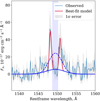 |
Fig. 8. The extracted HST COS FUV spectrum of NGC 3259 around the CIV lines binned to 0.15 Å pix−1. The best fitting model for the broad and narrow components are shown in blue and red, respectively. A dashed blue line shows the alternative best fitting model when the region between CIV lines (blue-shaded area) was masked. |
A typical Galactic AV-to-NH ratio of NH = (4 − 5)×1021 (Güver & Özel 2009) implies NH an order of magnitude lower than observed for the hard X-ray component, consistent with our X-ray analysis. If the central source had this moderate optical extinction we would detect optical continuum. The absence of a detectable optical continuum combined with the observed moderate BLR extinction support our interpretation that NGC 3259’s active nucleus is powered by a partially obscured LSMBH, partially obscured by a nearly edge-on thin dust torus.
An obscured, intrinsically luminous AGN powered by a higher-mass SMBH, could produce broad lines by scattering from circumnuclear dust clouds (e.g., Antonucci & Miller 1985). In this case the continuum would also be scattered, yielding a type-I AGN line-to-continuum ratio and strongly polarized continuum and line emission, which stands in contrast to our observations.
4.1.2. The nature of broad-line variability in NGC 3259
A detailed analysis of the Hα broad-line component will reveal time-variable asymmetries in the line profile. If the broad-line variability is due to variations in the intrinsic AGN luminosity, we should see an anti-correlation between the observed flux and width of the broad lines. However, in NGC 3259, we see that the broad-line flux increase is accompanied by an increased width and asymmetry in the line (ESI and STIS spectra; see Table 1).
Alternatively, the observed variable flux and asymmetries in the broad Hα could be attributed to the variable dust obscuration of the BLR. At different epochs, dust clouds within the torus obscure different regions of the BLR, although much of the BLR remains visible. The rapidly moving broad Hα emitting clouds in the central part of the BLR are more significantly affected by obscuration than those in the outer regions. The variable extinction should cause symmetric changes in both the red and blue high velocity wings of the broad lines. However, STIS, ESI (2004), ESI (2023) and Binospec observations reveal a blue wing (negative h3/h5), while SDSS and IDS datasets display a stronger red wing (positive h3/h5).
In the case of a nearly edge-on orientation of a thin torus, variation in extinction could explain the observed broad Hα variability in flux and shape. If the torus has a small scale-height, the central source may experience significant obscuration, while the BLR remains comparatively less affected. This scenario explains both the variability and the asymmetry of the broad Hα without invoking intrinsic BLR variability. However, it requires an unusual torus geometry, which makes it look more like a thin dusty disk.
The orbital timescales of gas clouds in the dusty torus and the BLR can be estimated using Kepler’s laws, assuming the clouds are in circular orbits dominated by the SMBH gravitational potential. These timescales provide crucial insights into the structure and dynamics of the AGN environment, influencing variability studies and reverberation mapping techniques (Peterson 1993, 2001).
The torus sublimation radius is set by the balance between dust grain sublimation and the AGN radiation field. Empirically, the dust sublimation radius scales with the UV luminosity as rsub ≈ 0.36 (LUV, 45)0.5 pc (e.g., Hönig et al. 2010), where LUV, 45 is the UV luminosity in units of 1045 erg s−1. We adopt LUV = 20 L0.2 − 10 keV (e.g., Lusso et al. 2012; Gupta et al. 2024) with a value of L0.2 − 10 keV = 1.5 × 1040 erg s−1 from Table 5. This yields rsub ≈ 0.006 pc ≈1.9 × 1016 cm. Assuming a Keplerian orbit for our best-fit BH mass, this implies an orbital period of ≳100 yr. This long timescale suggests that the torus structure, which is presumably the primary obscurer for the BLR, should remain relatively stable over the observational timescales of the broad-line variations we observe. Thus, we find that the LOS obscuration is an unlikely cause of the variability.
Another plausible scenario is an asymmetric distribution of BLR clouds orbiting the BH. For the BLR clouds, the virial radius can be estimated at rBLR ≈ GMBH/fvBLR2, where we adopt the maximum observed value of 2000 km s−1 for vBLR and a virial factor f ≈ 4 to account for geometric projection effects from reverberation mapping studies (e.g., Bentz & Katz 2015). This yields rBLR ≈ 0.8 − 1.6 light-days and an orbital period of ≈60−120 days (e.g., Kaspi et al. 2005). Intriguingly, this estimate is below the shortest timescales on which we observe variations in the broad Hα, thereby confirming it as a possibility; however, this might imply that the BLR is not fully virialized and our BH mass estimates may be biased. This scenario is confirmed by the broad-line blue and red wings that are variable on timescale of a few months. This timescale is consistent with our estimate from the BLR size.
Finally, the occasional blue wing excess and variability might be associated with frequent outflow events. Blueshifted asymmetric wings in broad emission lines have been widely interpreted as signatures of outflowing gas (e.g., Crenshaw et al. 2003; Veilleux et al. 2005). The key reasoning is that if a component of the BLR is moving radially outward from the AGN, the near-side (approaching the observer) produces a blueshifted broad emission, while the receding side may be obscured by the torus or the accretion disk (Murray & Chiang 1995). This creates a net blue asymmetry in the line profile.
Further confirmation of the above scenarios can come from velocity-resolved reverberation mapping (e.g., Du et al. 2018) or detecting associated UV/X-ray outflows.
4.1.3. Properties of the narrow-line region
The Baldwin-Phillips-Terlevich (BPT; Baldwin et al. 1981) classification in each spaxel (Fig. 2) of the IFU dataset clearly shows that the area of the AGN excitation mechanism has a disky morphology with the same position angle and inclination as the main disk of NGC 3259. This points to the dominating excitation by the AGN radiation in the thin disk, where the rotating gas is ionized. This type of shape for the NLR also suggests that there are no other significant gas reservoirs outside of the galaxy disk close to the nucleus (e.g. extraplanar gas).
We observed a 300−900 pc region around the nucleus with AGN excitation. The size of this region is consistent with the isophotal radius, Rint = 833 ± 310 pc, derived from the correlation of NLR (Rint) and L[OIII] (Zhang 2022).
The gas velocity dispersion is larger in the NLR area (Fig. 2, second panel in the second row). The increase possibly indicates a biconical outflow from the active nucleus, frequently observed in Seyfert galaxies. Another possibility is that the gas in the inner region is excited by shocks originating from the bar. However, the narrow HeII (λ = 4686 Å) line seen in the circumnuclear region of NGC 3259 without strong star formation suggests the presence of an AGN.
4.2. The inner bar and the central spheroid
In the Third Reference Catalogue of Bright Galaxies (RC3; de Vaucouleurs et al. 1991) NGC 3259 is classified as an intermediate-bar galaxy, SAB(rs)bc. The Sérsic index of the central spheroid is around 1, consistent with a pseudo-bulge (Kormendy & Kennicutt 2004). The central component of NGC 3259 has lower ellipticity (0.2−0.3) than the disk (0.4−0.5), suggesting a spheroidal component. However, the velocity dispersion does not deviate significantly from the Faber & Jackson (1976) relation for bulges.
The Hα surface brightness displayed in the Binospec IFU map (Fig. 2) decreases by an order of magnitude inside the central 5 arcsec (650 pc). This probably reflects the intrinsic decrease in the Hα surface brightness and not dust absorption because the Balmer decrement remains between 2.7 and 2.9. Neighboring emission lines that would be similarly absorbed by dust, [NII] and [SII], do not show a similar decrease (Fig. 2). Galaxies with bars that funnel gas inside the inner ring towards the galaxy center (Combes & Elmegreen 1993; Verley et al. 2007; George et al. 2020) show similar behavior. The gas and stellar velocity field isovels are S-shaped and inclined, also typical of barred galaxies (Lindblad et al. 1996; Aguerri et al. 2015; Randriamampandry et al. 2015).
However, despite strong kinematic evidence of a bar, optical to near-infrared images fail to provide the clear morphological signature of a bar. Only the HST NICMOS2 dataset in the F160W band subtly indicates an elongated structure on scales of 2 − 3 arcsec from the center. Isophotal analysis of this region shows an increase in ellipticity from 0.1 to 0.3, which subsequently returns to 0.1. In some situations, S-shaped isovelocity lines are less ambiguous evidence of a bar than the photometric analysis. In Fig. 9, we show the inclination-corrected Spitzer image of NGC 3259, with an extended component resembling a bar. The correction assumes a position angle PA = 16.5 deg. from the HyperLeda database14 and b/a = 0.45, inferred from our isophotal analysis of the disk. However, the inclination-corrected image may introduce an artifact from a slightly elliptical spheroidal component stretched along the minor axis. The bar identification in inclined galaxies from photometry is problematic for bar major axis orientations roughly aligned with the line of sight. Therefore, despite the lack of an unambiguous photometric signature of a bar, the light profile is consistent with the bar oriented along the galaxy’s minor axis detected spectroscopically.
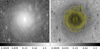 |
Fig. 9. Left: Inclination-corrected Spitzer IRAC1 image for NGC 3259. Right: Same with inverted color map and overlaid contours from 10 to 170 times the background level. We stretched the image along the minor axis of NGC 3259 with a coefficient b/a = 0.45 derived for the outer disk. |
Observations and simulations show that the dominant formation scenario of pseudo-bulges is secular evolution (Kormendy & Kennicutt 2004; Okamoto 2013) mainly driven by a bar (Combes et al. 1990; Combes 2016). After funneling the gas towards the galaxy center, gravity torques can stall the gas at the inner Lindblad resonance, preventing it from reaching the AGN (Buta & Combes 1996; Fanali et al. 2015). Growth of the central BH and pseudo-bulge can be suppressed despite the presence of a massive gas reservoir. NGC 3259 has such a large gas reservoir with a mass of MHI = 6.34 × 10⁹ M⊙ (Di Teodoro & Fraternali 2014).
4.3. The lack of the BH – spheroid coevolution
We convert the luminosity of the bulge (Sect. 3.4), into stellar mass using the M/L ratio of 0.62 (M/L)⊙ for the stellar population inferred from the optimally extracted spectrum from the ESI (2023) dataset assuming the Kroupa (2002) stellar initial mass function. NGC 3259’s estimated spheroid stellar mass of Msph* = 1.1 ± 0.2 × 10⁸ M⊙ is about an order of magnitude smaller than predicted by the scaling relation between MBH and  (Graham & Scott 2015). NGC 3259 is nearly a 3σ outlier from the relation (Fig. 10), a deviation also commonly observed in pseudo-bulges (Graham 2012; Kormendy & Ho 2013; Graham & Scott 2013). Since the scaling relation is primarily established for classical bulges, which grow with their central BHs through galaxy mergers (Kormendy & Ho 2013), we infer that mergers are not the principal growth mechanism for the central BH in NGC 3259. Instead, gas accretion appears to be the dominant growth channel. NGC 4395 is a close analog of NGC 3259 hosting an intermediate-mass BH, demonstrates a prominent bar; however, it does not have a bulge at all (Filippenko & Ho 2003).
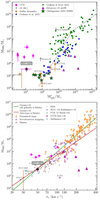 |
Fig. 10. Position (magenta star) of NGC 3259 on the Msph* − MBH and σsph* − MBH scaling relations. With the bar for MBH/M⊙ we demonstrate the BH mass range inferred from our multi-epoch spectroscopy, bar for Msph*/M⊙ shows a 3σ range for the spheroid mass estimate. Green stars – bona-fide sample of IMBH from Chilingarian et al. (2018). Magenta triangles: giant low-surface brightness galaxies (gLSB) from Saburova et al. (2021) with bulges formed mostly via in situ processes so the stellar masses of their central spheroids do not correlate with BH masses. On this figure we also demonstrate the following datasets: Baldassare et al. (2015, 2020), Zaw et al. (2020), Barth et al. (2004), Seth et al. (2014), Ahn et al. (2017, 2018), Afanasiev et al. (2018), Peterson et al. (2005), Kormendy et al. (1997), Nguyen et al. (2017, 2018). |
The σsph* derived from spectroscopy places NGC 3259 on the MBH − σsph* relation, while it is clearly an outlier from the MBH − Msph* relation. The difference of the NGC 3259 positions on the two scaling relations can be explained by the compactness of the bulge, which increases σsph*, or by the influence of the kinematics of the disk on the measurement. Fig. 4 displays quite high σdisk* ≈ 55 km s−1 and a slight decrease in the center to ∼45 km s−1. The latter value might result from the superposition of a bulge with a much lower intrinsic σsph* and a dynamically hot inner part of the disk.
4.4. Central black hole – nuclear star cluster coevolution
The NSC stellar mass cannot be precisely constrained from the F300X dataset decomposition because it requires an accurate assessment of its stellar population parameters to estimate (M/L). The near-UV (M/L) is significantly affected by small changes of the stellar age or the assumed star formation history of the NSC. To mitigate this effect, we estimate MNSC* from isophotal modeling of the F814W image (Sect. 3.4) because the (M/L) ratio in the red part of a spectrum is significantly less affected by the underlying star formation history. We converted the NSC luminosity assuming (M/L)F814W = 1.0(M/L)⊙ and obtained MNSC* = 9 × 10⁶ M⊙, suggesting that NGC 3259 follows scaling relations for NSCs (MBH/(MNSC + MBH)−MBH, see Graham & Spitler 2009; MBH/MNSC − MNSC, see Neumayer et al. 2020; MBH − MNSC, see Graham 2020).
4.5. Implications for the population of IMBHs in the local Universe
The identification of low-BH-mass AGNs (MBH < 106 M⊙) is limited by the broad-line component flux and width. Because NGC 3259 is relatively nearby, the detection of broad emission lines in its spectrum is possible. The correlation between the broad-line and the X-ray luminosities (Ueda et al. 2015) clearly confirms the presence of an AGN. However, in general, low-mass AGNs with low accretion rates are difficult to detect with current spectroscopic and X-ray surveys.
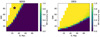 |
Fig. 11. Detectability of broad-line components simulated using the Binospec IFU NGC 3259 datacube for SDSS (left) and DESI (right). In each bin, the detection probability is color coded. White cells show the parameter space not simulated due to the limited datacube S/N. A pink star depicts the position corresponding to the NGC 3259 SDSS spectrum. |
4.5.1. Simulations of detectability of NGC 3259-like objects
To explore the detectability of NGC 3259-like objects in spectroscopic surveys such as SDSS and DESI, we performed a set of simulations using the Binospec data cube as input. We applied the same modeling to the simulated spectra using the NBursts spectral fitting package following the strategy for identifying low-mass AGNs by searching for objects with a broad emission line component in their spectra (Greene & Ho 2005, 2007; Chilingarian et al. 2018). We simulated spectra for an NGC 3259-like object at different distances and continuum signal-to-noise (S/N) levels. To mimic observations with a specific instrument at a given distance, we extracted spectra from the Binospec IFU cube within an aperture that matched such an observation. The extracted spectra were then convolved with a Gaussian, making the output spectrum resolving power matched to the simulated instrument by adjusting for the differences between the LSF of SDSS or DESI and Binospec. Finally, the degraded spectrum was resampled to the wavelength scale of the survey, and Gaussian noise was added to match the desired S/N level. We generated spectra with S/N ranging from 5 to 100 in steps of 5 and angular diameter distances from 5 to 100 Mpc in steps of 5 Mpc. For each combination of these two parameters, we generated 100 spectra with independent noise realizations.
We analyzed the simulated spectra using the NBURSTS package. The stellar continuum was modeled with X-shooter stellar population models, while Balmer emission lines were represented with a narrow and a broad component. We applied a ninth-degree multiplicative stellar continuum and a second-degree additive AGN continuum. Following Chilingarian et al. (2018), AGN detection is based on the difference in χ2 values between models with and without a broad-line component to determine where adding a broad component does not significantly improve the agreement between the model and the data. To calculate χ2 for the narrow-line-only scenario, we also ran the modeling without the second kinematic component for the broad emission lines, using the same procedure as for the case of the broad-line component.
Each simulated spectrum includes a broad-line component, but unreliable broad-line detections are filtered using criteria similar to those in Chilingarian et al. (2018): MBH/ΔMBH > 3 and χ2 − χbroad2 > 40, while number of d.f. was 1546 for modeling with broad-line component and 1550 for modeling without it. Additionally, we limited the velocity dispersion of the broad component to exclude cases with significant model mismatch.
Fig. 11 presents the detectability of the AGN in NGC 3259 as a function of distance and S/N. For SDSS, there is a strong distance threshold at 35 Mpc where even a large increase in S/N cannot significantly improve the chances of detecting the broad component. The currently observed SDSS spectrum falls within the region of nearly 100% detectability, validating the simulations. However, these results suggest that NGC 3259 is likely a unique object in the entire SDSS sample, as it is very close to the detectability limit.
Detection of objects like NGC 3259 is expected to be more efficient with the ongoing DESI survey. At the same S/N level, the limiting distance for DESI observations is 3.5−4 times larger than for SDSS, expanding the volume with high detection probability by up to 64 times. This improvement enables the detection of a larger population of LSMBHs with low accretion rates. Two factors dominate this improvement: (i) a smaller aperture size (1.5 arcsec vs. 3.0 arcsec for SDSS) reduces contribution from the stellar population and (ii) higher spectral resolution and better wavelength sampling disentangle broad components from narrow emission lines and stellar population absorption lines.
4.5.2. Comparison of NGC 3259 to a rapidly accreting IMBH
The simulations for NGC 3259 show that the broad-line component detection probability strongly depends on its amplitude relative to the contribution of the stellar population. At larger distances, resolving the stellar population is more difficult, lowering the contrast of the broad-line component.
We also study how detectability depends on the accretion rate by performing similar simulations for an AGN from a sample of confirmed intermediate-mass BHs (Chilingarian et al. 2018) recently observed with the Binospec-IFU: J110731.23+134712.8. This BH has a mass of MBH = (0.71 − 1.20)×105 M⊙, which is two to three times smaller than NGC 3259. Its broad-line component is three to four times narrower than that of NGC 3259, but its X-ray luminosity is 100 times higher, suggesting an Eddington ratio that is two orders of magnitude higher than that of NGC 3259.
We present these simulations in Fig. 12. This source is detected in SDSS at a distance ten times the detection limit for NGC 3259 at similar S/N due to the fact that the amplitude and contrast of the broad-line component are ten times higher. At distances > 400 Mpc, the optical fiber covers the entire galaxy and for a fixed S/N, the shape of the spectrum is independent of the distance. For a S/N of ∼40, we see that J110731.23+134712.8 is detectable to D > 400 Mpc, a volume that is ∼4000 times higher than that of NGC 3259. Therefore, we did miss a large population of LSMBHs accreting at very low Eddington ratios, however, we were able to easily detect IMBHs with high accretion rates with SDSS sensitivity.
This situation drastically improves with spectroscopic surveys like DESI (DESI Collaboration 2016) and 4MOST (de Jong et al. 2012), which both use smaller optical fibers and offer higher spectral resolution than SDSS. With DESI, J110731.23+134712.8-like objects will be detected up to 103 Mpc at S/N = 20, which will allow studies of samples of these AGNs in a cosmological context. Nevertheless, building AGN samples confirmed by X-ray observations will be limited by the availability of appropriately sensitive X-ray instruments and surveys covering a large fraction of the sky.
4.5.3. Limitations of X-ray observations
The eRASS1 (Merloni et al. 2024) soft X-ray survey from the first (2019–2020) full eROSITA scan of the sky has a typical depth of FX ∼ 5 × 10⁻¹³ erg cm−2 s−1, which is three times shallower than needed to detect NGC 3259. The expected depth of the eRASS4 survey completed before the end of eROSITA operations in 2022, will marginally detect nearby systems such as NGC 3259. However, if our interpretation of a nearly edge-on dusty torus is valid, we could expect the existence of many systems with similar intrinsic X-ray luminosities but without absorption. These sources will be detectable in eRASS4 to D = 60 − 80 Mpc and have a variable optical continuum that is detectable in time-domain surveys.
Overall, AGN candidates can be observed individually with the XMM-Newton and Chandra observatories, with exposure times adjusted to reach expected flux levels. The Chandra Source Catalog Release 2 Series reaches the depth of the NGC 3259 detection for almost all observations (Evans et al. 2024). However, if NGC 3259 was at a distance of 150 Mpc, it would only be detected in half of the Chandra archival datasets according to Evans et al. (2024). More than half of the exposures in the fourth XMM-Newton serendipitous source catalog (Webb et al. 2020) exceed 20 ks, allowing detection of NGC 3259-like objects to 250 Mpc.
Future X-ray missions will detect more low-accretion LSMBHs. The Advanced X-Ray Imaging Satellite (AXIS; Reynolds et al. 2023) mission, planned for the 2030s, will have a sensitivity that is ten times higher than Chandra. The Advanced Telescope for High Energy Astrophysics (Athena; Barcons et al. 2017) will have ten times larger effective area than XMM-Newton and a larger field of view.
4.5.4. Limitations on the detection of the AGN continuum variability
An AGN can also be identified by variable optical continuum using the Zwicky Transient Facility (ZTF; Bellm et al. 2019), the Asteroid Terrestrial-impact Last Alert System (ATLAS; Tonry et al. 2018) and the upcoming Legacy Survey of Space and Time (LSST; LSST Science Collaboration 2009). These surveys will allow us to identify large, relatively complete samples of AGN, including low-mass AGNs: IMBHs and LSMBHs (Demianenko et al. 2024).
The detection of the NGC 3259 continuum variability is prevented by strong obscuration of the central source. The NGC 3259 AGN continuum is less than 1% of the g-band flux in the SDSS aperture of 3 arcsec, which translates to < 0.02% of the integrated galaxy flux. This value is below the level of variability of most low-luminosity AGN: 84% of the objects from the weak type-I AGN sample from López-Navas et al. (2023) exhibit g-band variability above 0.4%. Reaching even 1% sensitivity for a > 19-th magnitude point source superposed on a bright host galaxy is challenging for ground-based time-domain surveys. However, unabsorbed AGN powered by low-Eddington LSMBHs and IMBHs similar to NGC 3259 but with different dust torus orientation should be easily detectable.
5. Conclusions
We studied NGC 3259 as an example of a LSMBH with MBH < 106 M⊙ accreting at a low Eddington ratio with the corresponding low AGN luminosity in the X-ray and in broad Hα. While the identification of similar galaxies with SDSS is challenging, DESI and future 4MOST observations will help to enlarge the sample by several orders of magnitude.
Our study of NGC 3259’s X-ray emission finds that X-rays from the AGN are obscured by a factor of ∼100 in the 0.2−2 keV band, which limits AGN detectability in X-rays and complicates separating the contribution from the stellar population, primarily high mass X-ray binaries.
Because NGC 3259 is located in a sparse galaxy group, it is not likely to have a rich merger history. The presence of a pseudo-bulge instead of a classical bulge supports this conclusion. The coevolution of the central spheroid and black hole significantly differs from the majority of other systems in this MBH range. Indeed, NGC 3259 departs by almost one order of magnitude from the Msph* − MBH scaling relation, in contrast to more massive SMBHs found in massive bulges and IMBHs that are accreting at high Eddington ratios.
Data availability
The long-slit, echelle, and IFU spectra for NGC 3259, presented in this study are available at https://doi.org/10.5281/zenodo.15836255. Additional data can be provided upon request to the corresponding author.
The reduced IFU cubes are available at the CDS via https://cdsarc.cds.unistra.fr/viz-bin/cat/J/A+A/702/A42
Here we refer to the circumcircle with a radius equal to the hexagon side length.
Major axis size.
Acknowledgments
Observations reported here were obtained at the MMT Observatory, a joint facility of the Smithsonian Institution and the University of Arizona. Kirill A. Grishin acknowledges support from ANR-24-CE31-2896. Igor Chilingarian’s research is supported by the SAO Telescope Data Center. He also acknowledges support from the NASA ADAP-22-0102 grant. Franz E. Bauer acknowledges support from ANID-Chile BASAL CATA FB210003, FONDECYT Regular 1241005, and Millennium Science Initiative, AIM23-0001. We thank G. Fabbiano and M. Elvis for fruitful discussions on the topic. Some of the data presented herein were obtained at Keck Observatory, which is a private 501(c)3 non-profit organization operated as a scientific partnership among the California Institute of Technology, the University of California, and the National Aeronautics and Space Administration. The Observatory was made possible by the generous financial support of the W. M. Keck Foundation. Funding for the SDSS and SDSS-II has been provided by the Alfred P. Sloan Foundation, the Participating Institutions, the National Science Foundation, the U.S. Department of Energy, the National Aeronautics and Space Administration, the Japanese Monbukagakusho, the Max Planck Society, and the Higher Education Funding Council for England. The SDSS Web Site is http://www.sdss.org/. The SDSS is managed by the Astrophysical Research Consortium for the Participating Institutions. The Participating Institutions are the American Museum of Natural History, Astrophysical Institute Potsdam, University of Basel, University of Cambridge, Case Western Reserve University, University of Chicago, Drexel University, Fermilab, the Institute for Advanced Study, the Japan Participation Group, Johns Hopkins University, the Joint Institute for Nuclear Astrophysics, the Kavli Institute for Particle Astrophysics and Cosmology, the Korean Scientist Group, the Chinese Academy of Sciences (LAMOST), Los Alamos National Laboratory, the Max-Planck-Institute for Astronomy (MPIA), the Max-Planck-Institute for Astrophysics (MPA), New Mexico State University, Ohio State University, University of Pittsburgh, University of Portsmouth, Princeton University, the United States Naval Observatory, and the University of Washington. Based on observations made with the NASA/ESA Hubble Space Telescope, and obtained from the Hubble Legacy Archive, which is a collaboration between the Space Telescope Science Institute (STScI/NASA), the Space Telescope European Coordinating Facility (ST-ECF/ESA) and the Canadian Astronomy Data Centre (CADC/NRC/CSA). This research is based on observations made with the NASA/ESA Hubble Space Telescope obtained from the Space Telescope Science Institute, which is operated by the Association of Universities for Research in Astronomy, Inc., under NASA contract NAS 5–26555. These observations are associated with programs 8228, 9395, 12557.
References
- Afanasiev, A. V., Chilingarian, I. V., Mieske, S., et al. 2018, MNRAS, 477, 4856 [Google Scholar]
- Aguerri, J. A. L., Méndez-Abreu, J., Falcón-Barroso, J., et al. 2015, A&A, 576, A102 [NASA ADS] [CrossRef] [EDP Sciences] [Google Scholar]
- Ahn, C. P., Seth, A. C., den Brok, M., et al. 2017, ApJ, 839, 72 [Google Scholar]
- Ahn, C. P., Seth, A. C., Cappellari, M., et al. 2018, ApJ, 858, 102 [Google Scholar]
- Ananna, T. T., Weigel, A. K., Trakhtenbrot, B., et al. 2022, ApJS, 261, 9 [NASA ADS] [CrossRef] [Google Scholar]
- Antonucci, R. R. J., & Miller, J. S. 1985, ApJ, 297, 621 [NASA ADS] [CrossRef] [Google Scholar]
- Aouad, C. J., James, P. A., & Chilingarian, I. V. 2020, MNRAS, 496, 5211 [CrossRef] [Google Scholar]
- Baldassare, V. F., Reines, A. E., Gallo, E., & Greene, J. E. 2015, ApJ, 809, L14 [NASA ADS] [CrossRef] [Google Scholar]
- Baldassare, V. F., Geha, M., & Greene, J. 2020, ApJ, 896, 10 [NASA ADS] [CrossRef] [Google Scholar]
- Baldwin, J. A., Phillips, M. M., & Terlevich, R. 1981, PASP, 93, 5 [Google Scholar]
- Barcons, X., Barret, D., Decourchelle, A., et al. 2017, Astron. Nachr., 338, 153 [NASA ADS] [CrossRef] [Google Scholar]
- Barth, A. J., Ho, L. C., Rutledge, R. E., & Sargent, W. L. W. 2004, ApJ, 607, 90 [NASA ADS] [CrossRef] [Google Scholar]
- Barth, A. J., Greene, J. E., & Ho, L. C. 2008, AJ, 136, 1179 [NASA ADS] [CrossRef] [Google Scholar]
- Begelman, M. C., Volonteri, M., & Rees, M. J. 2006, MNRAS, 370, 289 [NASA ADS] [CrossRef] [Google Scholar]
- Bellm, E. C., Kulkarni, S. R., Graham, M. J., et al. 2019, PASP, 131, 018002 [Google Scholar]
- Bender, R., Burstein, D., & Faber, S. M. 1992, ApJ, 399, 462 [NASA ADS] [CrossRef] [Google Scholar]
- Bentz, M. C., & Katz, S. 2015, PASP, 127, 67 [Google Scholar]
- Bhowmick, A. K., Blecha, L., Torrey, P., et al. 2025, MNRAS, 538, 518 [Google Scholar]
- Buta, R., & Combes, F. 1996, Fund. Cosmic Phys., 17, 95 [Google Scholar]
- Cammelli, V., Monaco, P., Tan, J. C., et al. 2025, MNRAS, 536, 851 [Google Scholar]
- Cappellari, M., & Copin, Y. 2003, MNRAS, 342, 345 [Google Scholar]
- Chilingarian, I. 2020, ASP Conf. Ser., 522, 623 [Google Scholar]
- Chilingarian, I. V., & Asa’d, R. A. 2018, ApJ, 858, 63 [NASA ADS] [CrossRef] [Google Scholar]
- Chilingarian, I. V., & Grishin, K. A. 2020, PASP, 132, 064503 [NASA ADS] [CrossRef] [Google Scholar]
- Chilingarian, I., & Grishin, K. 2025, ArXiv e-prints [arXiv:2501.17163] [Google Scholar]
- Chilingarian, I. V., Prugniel, P., Sil’Chenko, O. K., & Afanasiev, V. L. 2007a, MNRAS, 376, 1033 [NASA ADS] [CrossRef] [Google Scholar]
- Chilingarian, I., Prugniel, P., Sil’chenko, O., & Koleva, M. 2007b, IAU Symp., 241, 175 [Google Scholar]
- Chilingarian, I. V., Zolotukhin, I. Y., Katkov, I. Y., et al. 2017, ApJS, 228, 14 [NASA ADS] [CrossRef] [Google Scholar]
- Chilingarian, I. V., Katkov, I. Y., Zolotukhin, I. Y., et al. 2018, ApJ, 863, 1 [Google Scholar]
- Colless, M., Dalton, G., Maddox, S., et al. 2001, MNRAS, 328, 1039 [Google Scholar]
- Combes, F. 2016, Astrophys. Space Sci. Lib., 418, 413 [Google Scholar]
- Combes, F., & Elmegreen, B. G. 1993, A&A, 271, 391 [NASA ADS] [Google Scholar]
- Combes, F., Debbasch, F., Friedli, D., & Pfenniger, D. 1990, A&A, 233, 82 [NASA ADS] [Google Scholar]
- Crenshaw, D. M., Kraemer, S. B., & George, I. M. 2003, ARA&A, 41, 117 [NASA ADS] [CrossRef] [Google Scholar]
- Cseh, D., Webb, N. A., Godet, O., et al. 2015, MNRAS, 446, 3268 [NASA ADS] [CrossRef] [Google Scholar]
- de Jong, R. S., Bellido-Tirado, O., Chiappini, C., et al. 2012, SPIE Conf. Ser., 8446, 84460T [Google Scholar]
- de Jong, R. S., Agertz, O., Berbel, A. A., et al. 2019, The Messenger, 175, 3 [NASA ADS] [Google Scholar]
- de Vaucouleurs, G., de Vaucouleurs, A., Corwin, H. G., et al. 1991, Third Reference Catalogue of Bright Galaxies (New York: Springer) [Google Scholar]
- Demianenko, M., Grishin, K., Toptun, V., et al. 2024, ASP Conf. Ser., 535, 283 [Google Scholar]
- DESI Collaboration (Aghamousa, A., et al.) 2016, ArXiv e-prints [arXiv:1611.00036] [Google Scholar]
- Dewangan, G. C., Mathur, S., Griffiths, R. E., & Rao, A. R. 2008, ApJ, 689, 762 [NASA ADS] [CrossRef] [Google Scholar]
- Di Matteo, T., Colberg, J., Springel, V., Hernquist, L., & Sijacki, D. 2008, ApJ, 676, 33 [NASA ADS] [CrossRef] [Google Scholar]
- Di Teodoro, E. M., & Fraternali, F. 2014, A&A, 567, A68 [NASA ADS] [CrossRef] [EDP Sciences] [Google Scholar]
- Doe, S., Nguyen, D., Stawarz, C., et al. 2007, ASP Conf. Ser., 376, 543 [NASA ADS] [Google Scholar]
- Dong, X.-B., Ho, L. C., Yuan, W., et al. 2012, ApJ, 755, 167 [Google Scholar]
- Du, P., Brotherton, M. S., Wang, K., et al. 2018, ApJ, 869, 142 [CrossRef] [Google Scholar]
- Evans, I. N., Evans, J. D., Martínez-Galarza, J. R., et al. 2024, ApJS, 274, 22 [NASA ADS] [CrossRef] [Google Scholar]
- Fabbiano, G., & Elvis, M. 2022, in Handbook of X-ray and Gamma-ray Astrophysics, eds. C. Bambi, & A. Sangangelo, 92 [Google Scholar]
- Faber, S. M., & Jackson, R. E. 1976, ApJ, 204, 668 [Google Scholar]
- Fabricant, D., Fata, R., Epps, H., et al. 2019, PASP, 131, 075004 [NASA ADS] [CrossRef] [Google Scholar]
- Fabricant, D., Ben-Ami, S., Chilingarian, I. V., et al. 2025, PASP, 137, 015002 [Google Scholar]
- Fanali, R., Dotti, M., Fiacconi, D., & Haardt, F. 2015, MNRAS, 454, 3641 [Google Scholar]
- Filippenko, A. V., & Ho, L. C. 2003, ApJ, 588, L13 [NASA ADS] [CrossRef] [Google Scholar]
- Filippenko, A. V., & Sargent, W. L. W. 1989, ApJ, 342, L11 [NASA ADS] [CrossRef] [Google Scholar]
- Gabriel, C., Denby, M., Fyfe, D. J., et al. 2004, ASP Conf. Ser., 314, 759 [Google Scholar]
- Gadotti, D. A. 2009, MNRAS, 393, 1531 [Google Scholar]
- Gaia Collaboration (Vallenari, A., et al.) 2023, A&A, 674, A1 [NASA ADS] [CrossRef] [EDP Sciences] [Google Scholar]
- George, K., Joseph, P., Mondal, C., et al. 2020, A&A, 644, A79 [NASA ADS] [CrossRef] [EDP Sciences] [Google Scholar]
- Godet, O., Lombardi, J. C., Antonini, F., et al. 2014, ApJ, 793, 105 [NASA ADS] [CrossRef] [Google Scholar]
- Goodman, J., & Weare, J. 2010, Commun. Appl. Math. Comput. Sci., 5, 65 [Google Scholar]
- Graham, A. W. 2012, ApJ, 746, 113 [NASA ADS] [CrossRef] [Google Scholar]
- Graham, A. W. 2020, MNRAS, 492, 3263 [Google Scholar]
- Graham, A. W. 2024, MNRAS, 535, 299 [Google Scholar]
- Graham, A. W., & Sahu, N. 2023, MNRAS, 518, 2177 [Google Scholar]
- Graham, A. W., & Scott, N. 2013, ApJ, 764, 151 [Google Scholar]
- Graham, A. W., & Scott, N. 2015, ApJ, 798, 54 [Google Scholar]
- Graham, A. W., & Soria, R. 2019, MNRAS, 484, 794 [Google Scholar]
- Graham, A. W., & Spitler, L. R. 2009, MNRAS, 397, 2148 [NASA ADS] [CrossRef] [Google Scholar]
- Graham, A. W., Soria, R., & Davis, B. L. 2019, MNRAS, 484, 814 [NASA ADS] [Google Scholar]
- Green, J. C., Froning, C. S., Osterman, S., et al. 2012, ApJ, 744, 60 [NASA ADS] [CrossRef] [Google Scholar]
- Greene, J. E., & Ho, L. C. 2004, ApJ, 610, 722 [NASA ADS] [CrossRef] [Google Scholar]
- Greene, J. E., & Ho, L. C. 2005, ApJ, 630, 122 [NASA ADS] [CrossRef] [Google Scholar]
- Greene, J. E., & Ho, L. C. 2007, ApJ, 670, 92 [NASA ADS] [CrossRef] [Google Scholar]
- Greene, J. E., Strader, J., & Ho, L. C. 2020, ARA&A, 58, 257 [Google Scholar]
- Grier, C. J., Martini, P., Watson, L. C., et al. 2013, ApJ, 773, 90 [CrossRef] [Google Scholar]
- Gupta, K. K., Ricci, C., Temple, M. J., et al. 2024, A&A, 691, A203 [NASA ADS] [CrossRef] [EDP Sciences] [Google Scholar]
- Güver, T., & Özel, F. 2009, MNRAS, 400, 2050 [Google Scholar]
- Ho, L. C., Filippenko, A. V., & Sargent, W. L. W. 1997a, ApJS, 112, 315 [NASA ADS] [CrossRef] [Google Scholar]
- Ho, L. C., Filippenko, A. V., Sargent, W. L. W., & Peng, C. Y. 1997b, ApJS, 112, 391 [NASA ADS] [CrossRef] [Google Scholar]
- Hönig, S. F., Kishimoto, M., Gandhi, P., et al. 2010, A&A, 515, A23 [CrossRef] [EDP Sciences] [Google Scholar]
- Horne, K. 1986, PASP, 98, 609 [Google Scholar]
- Hoyer, N., Neumayer, N., Seth, A. C., Georgiev, I. Y., & Greene, J. E. 2023, MNRAS, 520, 4664 [CrossRef] [Google Scholar]
- Husser, T. O., Wende-von Berg, S., Dreizler, S., et al. 2013, A&A, 553, A6 [NASA ADS] [CrossRef] [EDP Sciences] [Google Scholar]
- Iwasawa, K., Fabian, A. C., Almaini, O., et al. 2000, MNRAS, 318, 879 [Google Scholar]
- Kamizasa, N., Terashima, Y., & Awaki, H. 2012, ApJ, 751, 39 [NASA ADS] [CrossRef] [Google Scholar]
- Kansky, J., Chilingarian, I., Fabricant, D., et al. 2019, PASP, 131, 075005 [CrossRef] [Google Scholar]
- Kaspi, S., Maoz, D., Netzer, H., et al. 2005, ApJ, 629, 61 [Google Scholar]
- Kimbrell, S. J., Reines, A. E., Schutte, Z., Greene, J. E., & Geha, M. 2021, ApJ, 911, 134 [CrossRef] [Google Scholar]
- King, I. 1962, AJ, 67, 471 [Google Scholar]
- Kormendy, J., & Ho, L. C. 2013, ARA&A, 51, 511 [Google Scholar]
- Kormendy, J., & Kennicutt, R. C. 2004, ARA&A, 42, 603 [Google Scholar]
- Kormendy, J., Bender, R., Magorrian, J., et al. 1997, ApJ, 482, L139 [NASA ADS] [CrossRef] [Google Scholar]
- Kourkchi, E., Courtois, H. M., Graziani, R., et al. 2020, AJ, 159, 67 [NASA ADS] [CrossRef] [Google Scholar]
- Krist, J. E., Hook, R. N., & Stoehr, F. 2011, SPIE Conf. Ser., 8127, 81270J [Google Scholar]
- Kroupa, P. 2002, Science, 295, 82 [Google Scholar]
- Lee, M. H. 1993, ApJ, 418, 147 [Google Scholar]
- Lehmer, B. D., Basu-Zych, A. R., Mineo, S., et al. 2016, ApJ, 825, 7 [Google Scholar]
- Lindblad, P. A. B., Lindblad, P. O., & Athanassoula, E. 1996, A&A, 313, 65 [NASA ADS] [Google Scholar]
- Loeb, A., & Rasio, F. A. 1994, ApJ, 432, 52 [Google Scholar]
- López-Navas, E., Arévalo, P., Bernal, S., et al. 2023, MNRAS, 518, 1531 [Google Scholar]
- LSST Science Collaboration (Abell, P. A., et al.) 2009, ArXiv e-prints [arXiv:0912.0201] [Google Scholar]
- Lusso, E., Comastri, A., Simmons, B. D., et al. 2012, MNRAS, 425, 623 [Google Scholar]
- Ma, J., Maksym, W. P., Fabbiano, G., et al. 2021, ApJ, 908, 155 [Google Scholar]
- Maiolino, R., Marconi, A., Salvati, M., et al. 2001, A&A, 365, 28 [NASA ADS] [CrossRef] [EDP Sciences] [Google Scholar]
- Maksym, W. P., Fabbiano, G., Elvis, M., et al. 2016, ApJ, 829, 46 [NASA ADS] [CrossRef] [Google Scholar]
- Matt, G., Guainazzi, M., & Maiolino, R. 2003, MNRAS, 342, 422 [NASA ADS] [CrossRef] [Google Scholar]
- Mejía-Restrepo, J. E., Trakhtenbrot, B., Koss, M. J., et al. 2022, ApJS, 261, 5 [CrossRef] [Google Scholar]
- Merloni, A., Lamer, G., Liu, T., et al. 2024, A&A, 682, A34 [NASA ADS] [CrossRef] [EDP Sciences] [Google Scholar]
- Merritt, D., & Milosavljević, M. 2005, Liv. Rev. Relat., 8, 8 [NASA ADS] [Google Scholar]
- Mezcua, M., Roberts, T. P., Sutton, A. D., & Lobanov, A. P. 2013, MNRAS, 436, 3128 [NASA ADS] [CrossRef] [Google Scholar]
- Moffat, A. F. J. 1969, A&A, 3, 455 [NASA ADS] [Google Scholar]
- Murray, N., & Chiang, J. 1995, ApJ, 454, L105 [NASA ADS] [Google Scholar]
- Neumayer, N., Seth, A., & Böker, T. 2020, A&ARv, 28, 4 [Google Scholar]
- Newville, M., Stensitzki, T., Allen, D. B., et al. 2016, Astrophysics Source Code Library [record ascl:1606.014] [Google Scholar]
- Nguyen, D. D., Seth, A. C., den Brok, M., et al. 2017, ApJ, 836, 237 [NASA ADS] [CrossRef] [Google Scholar]
- Nguyen, D. D., Seth, A. C., Neumayer, N., et al. 2018, ApJ, 858, 118 [NASA ADS] [CrossRef] [Google Scholar]
- Nguyen, D. D., Seth, A. C., Neumayer, N., et al. 2019, ApJ, 872, 104 [Google Scholar]
- Okamoto, T. 2013, MNRAS, 428, 718 [NASA ADS] [CrossRef] [Google Scholar]
- Oke, J. B., & Gunn, J. E. 1983, ApJ, 266, 713 [NASA ADS] [CrossRef] [Google Scholar]
- Osterbrock, D. E., & Ferland, G. J. 2006, Astrophysics of Gaseous Nebulae and Active Galactic Nuclei (Sausalito: University Science Books) [Google Scholar]
- Peterson, B. M. 1993, PASP, 105, 247 [NASA ADS] [CrossRef] [Google Scholar]
- Peterson, B. M. 2001, in Advanced Lectures on the Starburst-AGN, eds. I. Aretxaga, D. Kunth, & R. Mújica, 3 [Google Scholar]
- Peterson, B. M., Bentz, M. C., Desroches, L.-B., et al. 2005, ApJ, 632, 799 [NASA ADS] [CrossRef] [Google Scholar]
- Portegies Zwart, S. F., Baumgardt, H., Hut, P., Makino, J., & McMillan, S. L. W. 2004, Nature, 428, 724 [Google Scholar]
- Prieto, M., Aguerri, J. A. L., Varela, A. M., & Muñoz-Tuñón, C. 2001, A&A, 367, 405 [NASA ADS] [CrossRef] [EDP Sciences] [Google Scholar]
- Quinlan, G. D., & Shapiro, S. L. 1990, ApJ, 356, 483 [NASA ADS] [CrossRef] [Google Scholar]
- Randriamampandry, T. H., Combes, F., Carignan, C., & Deg, N. 2015, MNRAS, 454, 3743 [NASA ADS] [CrossRef] [Google Scholar]
- Reines, A. E., Greene, J. E., & Geha, M. 2013, ApJ, 775, 116 [Google Scholar]
- Revnivtsev, M., Churazov, E., Sazonov, S., Forman, W., & Jones, C. 2007, A&A, 473, 783 [NASA ADS] [CrossRef] [EDP Sciences] [Google Scholar]
- Reynolds, C. S., Kara, E. A., Mushotzky, R. F., et al. 2023, SPIE Conf. Ser., 12678, 126781E [Google Scholar]
- Riess, A. G., Scolnic, D., Anand, G. S., et al. 2024, ApJ, 977, 120 [NASA ADS] [CrossRef] [Google Scholar]
- Risaliti, G., Elvis, M., Fabbiano, G., Baldi, A., & Zezas, A. 2005, ApJ, 623, L93 [Google Scholar]
- Saburova, A. S., Chilingarian, I. V., Kasparova, A. V., et al. 2021, MNRAS, 503, 830 [NASA ADS] [CrossRef] [Google Scholar]
- Sassano, F., Schneider, R., Valiante, R., et al. 2021, MNRAS, 506, 613 [CrossRef] [Google Scholar]
- Seth, A. C., Cappellari, M., Neumayer, N., et al. 2010, ApJ, 714, 713 [NASA ADS] [CrossRef] [Google Scholar]
- Seth, A. C., van den Bosch, R., Mieske, S., et al. 2014, Nature, 513, 398 [CrossRef] [Google Scholar]
- Shaya, E. J., Tully, R. B., Hoffman, Y., & Pomarède, D. 2017, ApJ, 850, 207 [NASA ADS] [CrossRef] [Google Scholar]
- Sheinis, A. I., Bolte, M., Epps, H. W., et al. 2002, PASP, 114, 851 [Google Scholar]
- Singh, J., Monaco, P., & Tan, J. C. 2023, MNRAS, 525, 969 [NASA ADS] [CrossRef] [Google Scholar]
- Tonry, J. L., Denneau, L., Heinze, A. N., et al. 2018, PASP, 130, 064505 [Google Scholar]
- Tully, R. B., Courtois, H. M., & Sorce, J. G. 2016, AJ, 152, 50 [Google Scholar]
- Ueda, Y., Hashimoto, Y., Ichikawa, K., et al. 2015, ApJ, 815, 1 [NASA ADS] [CrossRef] [Google Scholar]
- Ulvestad, J. S., Greene, J. E., & Ho, L. C. 2007, ApJ, 661, L151 [NASA ADS] [CrossRef] [Google Scholar]
- Veilleux, S., Cecil, G., & Bland-Hawthorn, J. 2005, ARA&A, 43, 769 [NASA ADS] [CrossRef] [Google Scholar]
- Verley, S., Combes, F., Verdes-Montenegro, L., Bergond, G., & Leon, S. 2007, A&A, 474, 43 [NASA ADS] [CrossRef] [EDP Sciences] [Google Scholar]
- Verro, K., Trager, S. C., Peletier, R. F., et al. 2022, A&A, 661, A50 [NASA ADS] [CrossRef] [EDP Sciences] [Google Scholar]
- Volonteri, M. 2012, Science, 337, 544 [NASA ADS] [CrossRef] [Google Scholar]
- Webb, N. A., Coriat, M., Traulsen, I., et al. 2020, A&A, 641, A136 [NASA ADS] [CrossRef] [EDP Sciences] [Google Scholar]
- Weigel, A. K., Schawinski, K., Caplar, N., et al. 2017, ApJ, 845, 134 [NASA ADS] [CrossRef] [Google Scholar]
- Woodgate, B. E., Kimble, R. A., Bowers, C. W., et al. 1998, PASP, 110, 1183 [NASA ADS] [CrossRef] [Google Scholar]
- Xiao, T., Barth, A. J., Greene, J. E., et al. 2011, ApJ, 739, 28 [NASA ADS] [CrossRef] [Google Scholar]
- York, D. G., Adelman, J., Anderson, J. E., et al. 2000, AJ, 120, 1579 [Google Scholar]
- Yuan, W., Zhou, H., Dou, L., et al. 2014, ApJ, 782, 55 [Google Scholar]
- Zaw, I., Rosenthal, M. J., Katkov, I. Y., et al. 2020, ApJ, 897, 111 [NASA ADS] [CrossRef] [Google Scholar]
- Zhang, X. 2022, ApJS, 260, 31 [NASA ADS] [CrossRef] [Google Scholar]
- Zhao, G., Zhao, Y.-H., Chu, Y.-Q., Jing, Y.-P., & Deng, L.-C. 2012, RAA, 12, 723 [Google Scholar]
Appendix A: Integration of a Gaussian profile in hexagonal IFU spaxels
To precisely evaluate the 3D point-source broad-line component in the Binospec datacube we integrated the the model PSF flux within each spaxel. Only this approach provides accurate results for undersampled datasets (Chilingarian & Grishin 2025). However, a 2D numerical integration is computationally expensive.
To simplify the 2D integration we transform the original integral into a contour integral using Green’s theorem:
 (A.1)
(A.1)
where R is the 2D integration region and C is its edge. In Fig. A.1 we give an example of an integration contour for the edge of a lenslet. We need to find the functions P(x, y) and Q(x, y) that satisfy the following equation:  where f(x, y) is a model flux distribution. In our case, where f(x, y) is a 2D Gaussian, we derive the following expressions for P(x, y) and Q(x, y) by solving first-order differential equation:
where xc and yc are the coordinates of the center of the Gaussian PSF. Using these expressions we have transformed the 2D integral to a 1D integral over a spaxel contour. This transformation allows us to reduce the dimensionality of the integration problem and therefore the overall computational time.
 |
Fig. A.1. Example of integration over a hexagonal contour overlaid on a 2D Gaussian profile. |
To optimize the computation for the full lenslet array we can numerically integrate the vector functions P(x, y) and Q(x, y) where the number of elements corresponds to the number of spaxels.
Analytic calculations for other PSF profiles commonly used in astronomy, for instance the more realistic Moffat (1969) profile are harder, because the variables in the differential equations cannot be easily separated. Here, numerical 2D integration is required.
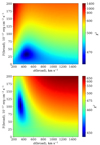 |
Fig. A.2. χ2 maps for the flux and velocity dispersion for the broad components, inferred from the modeling of COS spectrum for the cases without (top) and with the mask (bottom) on the central region. |
All Tables
Properties of the broad emission line components with statistical uncertainties obtained from the full spectral fitting.
Properties of the stellar populations and narrow emission lines inferred from the full spectral fitting.
Parameters of the photometric components inferred from the modeling of 1D surface brightness profile extracted in the isophote analysis of the F814W imaging dataset for NGC 3259.
Properties of central components estimated with Galfit modeling of the F330W HST image.
All Figures
|
Fig. 1. Color image of NGC 3259 produced by combining F435W and F814W HST ACS/WFC images. The green dashed rectangle shows the Binospec IFU field of view and the inset is the portion of the F330W HST ACS/HRC image in the Binospec IFU field of view. |
| In the text | |
|
Fig. 2. Analysis results from the NGC 3259 Binospec IFU datacube. First (top) row: 1. Stellar population velocity (Vstars). 2. Stellar population velocity dispersion (σstars). 3. Simple stellar population age (TSSP). 4. SSP ([Z/H]SSP) metallicity. Second row: 1. Hα emission line velocity (Vgas). 2. Hα emission line velocity dispersion (σgas); 3. Reduced χ2 in each spaxel. 4. Hα emission line flux. Third row: emission line ratios: 1. [O III]/Hβ. 2. [N II]/Hα; 3. Balmer decrement for the narrow-line component, Hα/Hβ. 4. [O III] emission line flux. Fourth (bottom) row: BPT diagrams (1 & 2) with the position of each spaxel with color-coded inclination-corrected distance from the galaxy center, underlying grey points represent position of galaxies from RCSED (Chilingarian et al. 2017). 3–4: Color-coded classification of spaxels according to their position on the BPT diagram. In each panel (rows 1–3) we show the center of the broad-line point source with a black cross. |
| In the text | |
|
Fig. 3. Results of the full spectral fitting of the -epoch dataset for NGC 3259. In each row: Emission line decomposition for the Hα+[NII], Hβ, [OIII], and [SII] regions. Colors coding is as follows: black is the data, blue is the narrow-line components, red is the broad-line component, and magenta is the total model of the emission lines. Residuals and uncertainties are shown in gray. The left panels maintain the same flux scale to emphasize the broad-line variability. |
| In the text | |
|
Fig. 4. Profiles of the stellar radial velocity (v), velocity dispersion (σ), SSP-equivalent ages and metallicities for NGC 3259 inferred from X-shooter SSP models for the Keck ESI (2023) dataset. The solid gray line in the top panel shows a reconstructed brightness profile along the slit in arbitrary units. |
| In the text | |
|
Fig. 5. Results of isophotal analysis of HST ACS/WFC images of NGC 3259 in the F814W band. Left panel: Surface brightness (μF814W) profile with the best-fitting model (red line) and its components (green dashed lines); residuals are shown in the bottom sub-panel. Middle panel: Ellipticity (ε) of isophotes. Right panel: Position angle (PA) of isophotes. |
| In the text | |
|
Fig. 6. Results of the decomposition of the F330W HST ACS/HRC dataset with GALFIT. Each panel measures 1 × 1 arcsec, north is up, east is to the left. The Sérsic + PSF model is shown. |
| In the text | |
|
Fig. 7. NGC 3259 X-ray data. Left: X-ray images of NGC 3259 from the XMM-Newton MOS1,2 and PN instruments. Right: X-ray spectral models for the XMM-Newton datasets, obtained in 2006 (black) and 2011 (red). The residuals, divided by the error, are shown in the bottom panel. |
| In the text | |
|
Fig. 8. The extracted HST COS FUV spectrum of NGC 3259 around the CIV lines binned to 0.15 Å pix−1. The best fitting model for the broad and narrow components are shown in blue and red, respectively. A dashed blue line shows the alternative best fitting model when the region between CIV lines (blue-shaded area) was masked. |
| In the text | |
|
Fig. 9. Left: Inclination-corrected Spitzer IRAC1 image for NGC 3259. Right: Same with inverted color map and overlaid contours from 10 to 170 times the background level. We stretched the image along the minor axis of NGC 3259 with a coefficient b/a = 0.45 derived for the outer disk. |
| In the text | |
|
Fig. 10. Position (magenta star) of NGC 3259 on the Msph* − MBH and σsph* − MBH scaling relations. With the bar for MBH/M⊙ we demonstrate the BH mass range inferred from our multi-epoch spectroscopy, bar for Msph*/M⊙ shows a 3σ range for the spheroid mass estimate. Green stars – bona-fide sample of IMBH from Chilingarian et al. (2018). Magenta triangles: giant low-surface brightness galaxies (gLSB) from Saburova et al. (2021) with bulges formed mostly via in situ processes so the stellar masses of their central spheroids do not correlate with BH masses. On this figure we also demonstrate the following datasets: Baldassare et al. (2015, 2020), Zaw et al. (2020), Barth et al. (2004), Seth et al. (2014), Ahn et al. (2017, 2018), Afanasiev et al. (2018), Peterson et al. (2005), Kormendy et al. (1997), Nguyen et al. (2017, 2018). |
| In the text | |
|
Fig. 11. Detectability of broad-line components simulated using the Binospec IFU NGC 3259 datacube for SDSS (left) and DESI (right). In each bin, the detection probability is color coded. White cells show the parameter space not simulated due to the limited datacube S/N. A pink star depicts the position corresponding to the NGC 3259 SDSS spectrum. |
| In the text | |
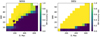 |
Fig. 12. Same as Fig. 11, but for J110731.23+134712.8. |
| In the text | |
|
Fig. A.1. Example of integration over a hexagonal contour overlaid on a 2D Gaussian profile. |
| In the text | |
|
Fig. A.2. χ2 maps for the flux and velocity dispersion for the broad components, inferred from the modeling of COS spectrum for the cases without (top) and with the mask (bottom) on the central region. |
| In the text | |
Current usage metrics show cumulative count of Article Views (full-text article views including HTML views, PDF and ePub downloads, according to the available data) and Abstracts Views on Vision4Press platform.
Data correspond to usage on the plateform after 2015. The current usage metrics is available 48-96 hours after online publication and is updated daily on week days.
Initial download of the metrics may take a while.