Fig. 3.
Download original image
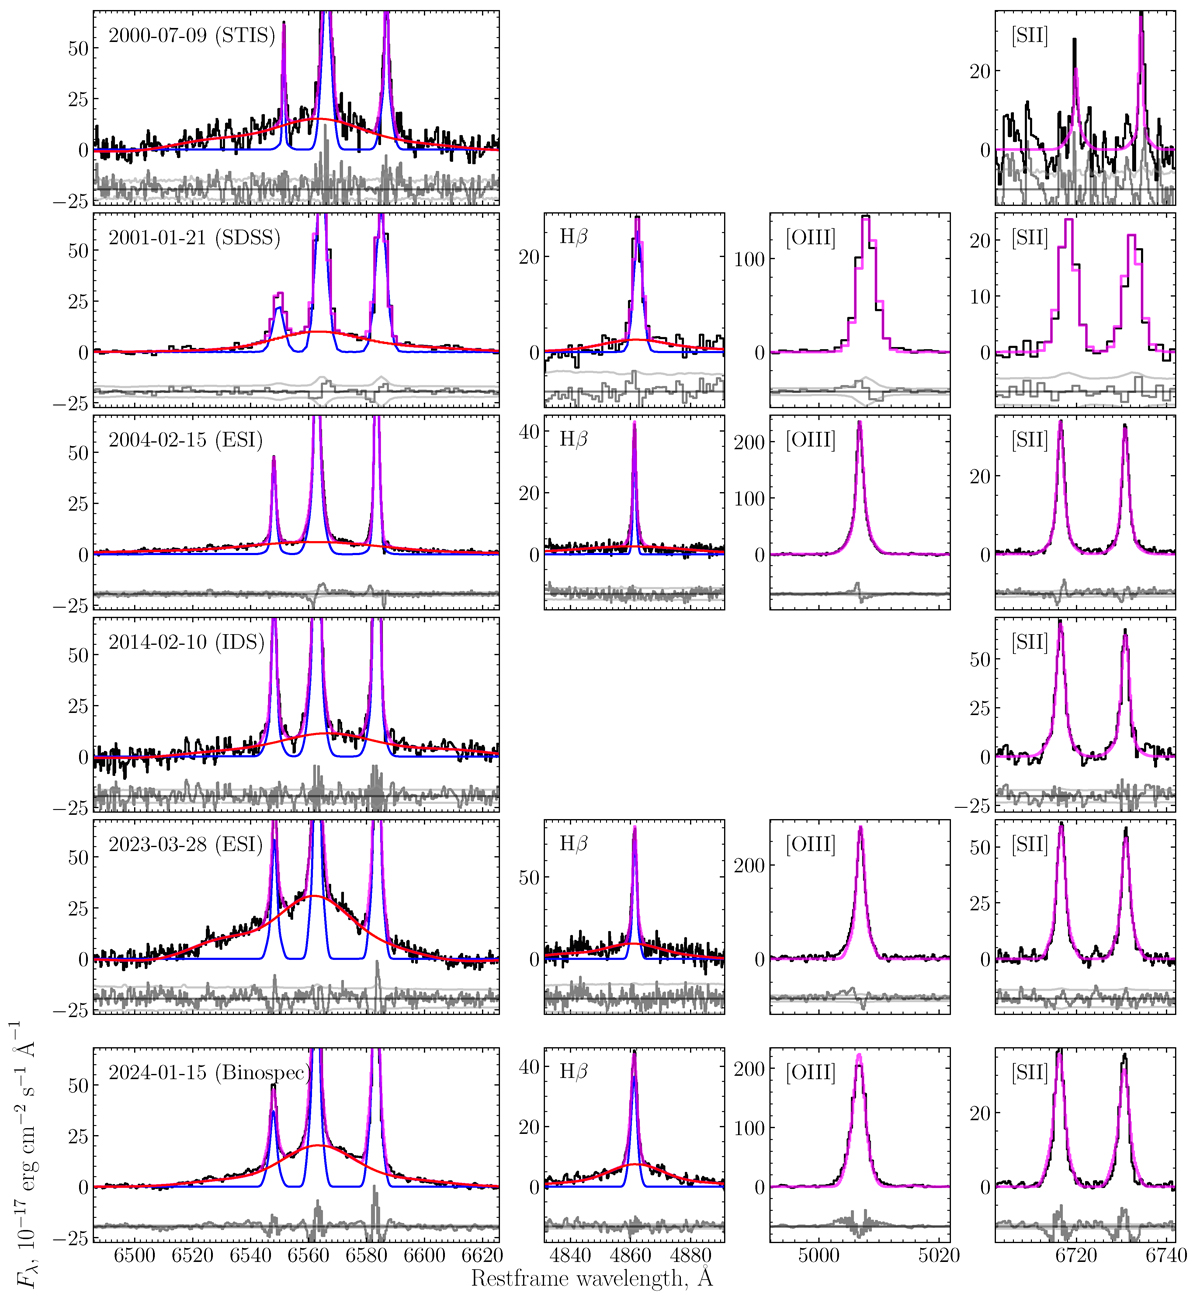
Results of the full spectral fitting of the -epoch dataset for NGC 3259. In each row: Emission line decomposition for the Hα+[NII], Hβ, [OIII], and [SII] regions. Colors coding is as follows: black is the data, blue is the narrow-line components, red is the broad-line component, and magenta is the total model of the emission lines. Residuals and uncertainties are shown in gray. The left panels maintain the same flux scale to emphasize the broad-line variability.
Current usage metrics show cumulative count of Article Views (full-text article views including HTML views, PDF and ePub downloads, according to the available data) and Abstracts Views on Vision4Press platform.
Data correspond to usage on the plateform after 2015. The current usage metrics is available 48-96 hours after online publication and is updated daily on week days.
Initial download of the metrics may take a while.