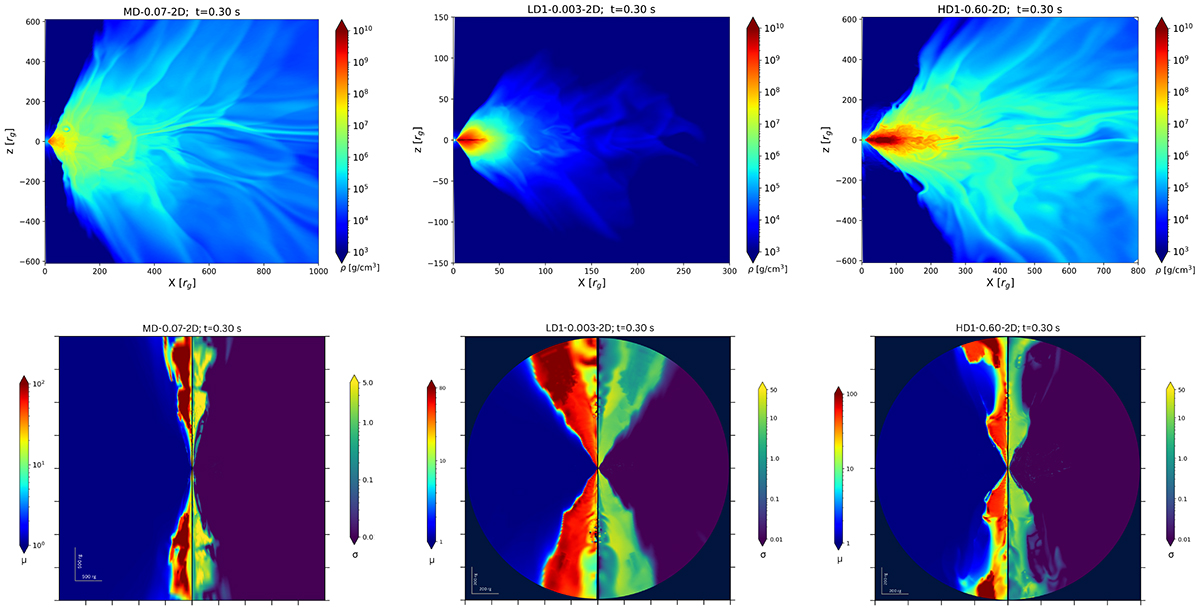
Fig. 2.
Download original image
Density distribution and jet structure at t = 0.3 seconds for three different models. Top row: Density plots of the accretion disk illustrating variations in the disk’s evolution across the three models. Bottom row: μ and σ parameters for each model, reflecting the jet energy distribution and magnetic field strength variations, respectively.
Current usage metrics show cumulative count of Article Views (full-text article views including HTML views, PDF and ePub downloads, according to the available data) and Abstracts Views on Vision4Press platform.
Data correspond to usage on the plateform after 2015. The current usage metrics is available 48-96 hours after online publication and is updated daily on week days.
Initial download of the metrics may take a while.