Fig. 1.
Download original image
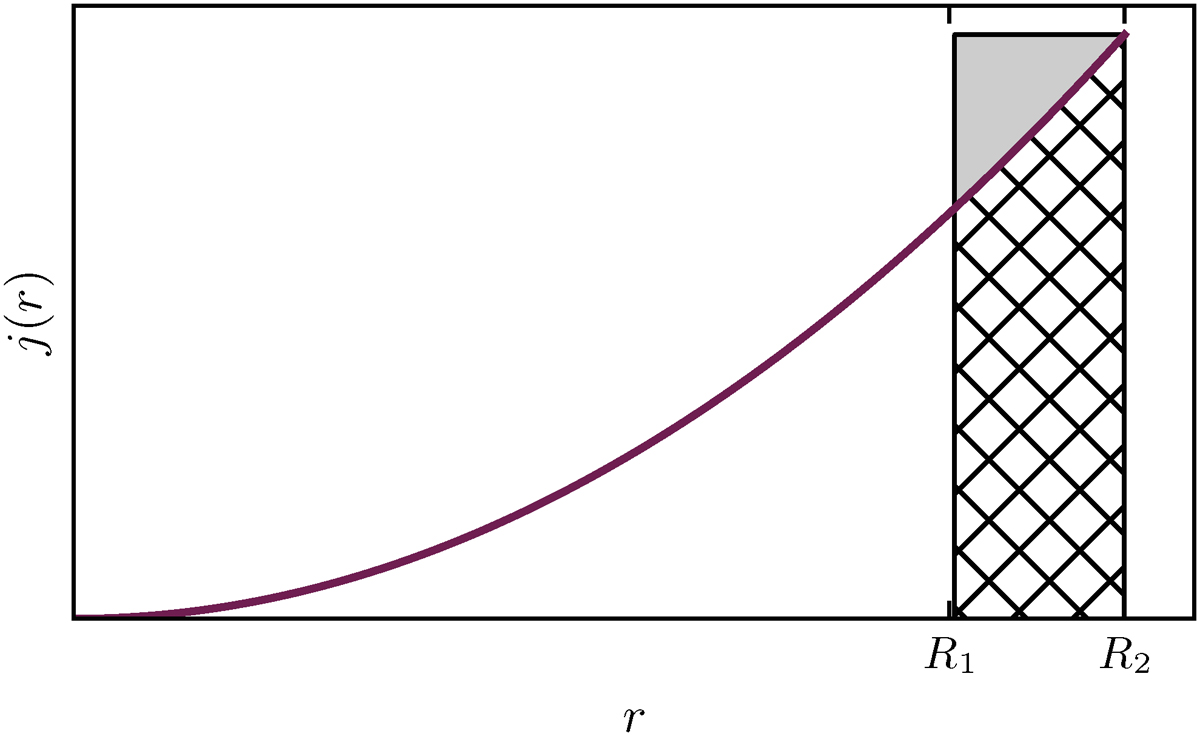
Schematic diagram of the specific internal angular momentum j of a model as a function of radius coordinate r, illustrating the angular momentum loss prescriptions corresponding to Eqs. (1) and (2). The width of the hatched area indicates the radius range that contains the material that is removed from the model within one timestep, where R2 corresponds to the stellar surface of the considered model, and R1 marks the layer that becomes the stellar surface after the next timestep. The prescription implemented in the Brott models removes the angular momentum represented by the hatched area. The new prescription removes the angular momentum in the hatched plus the shaded area.
Current usage metrics show cumulative count of Article Views (full-text article views including HTML views, PDF and ePub downloads, according to the available data) and Abstracts Views on Vision4Press platform.
Data correspond to usage on the plateform after 2015. The current usage metrics is available 48-96 hours after online publication and is updated daily on week days.
Initial download of the metrics may take a while.