Fig. 2.
Download original image
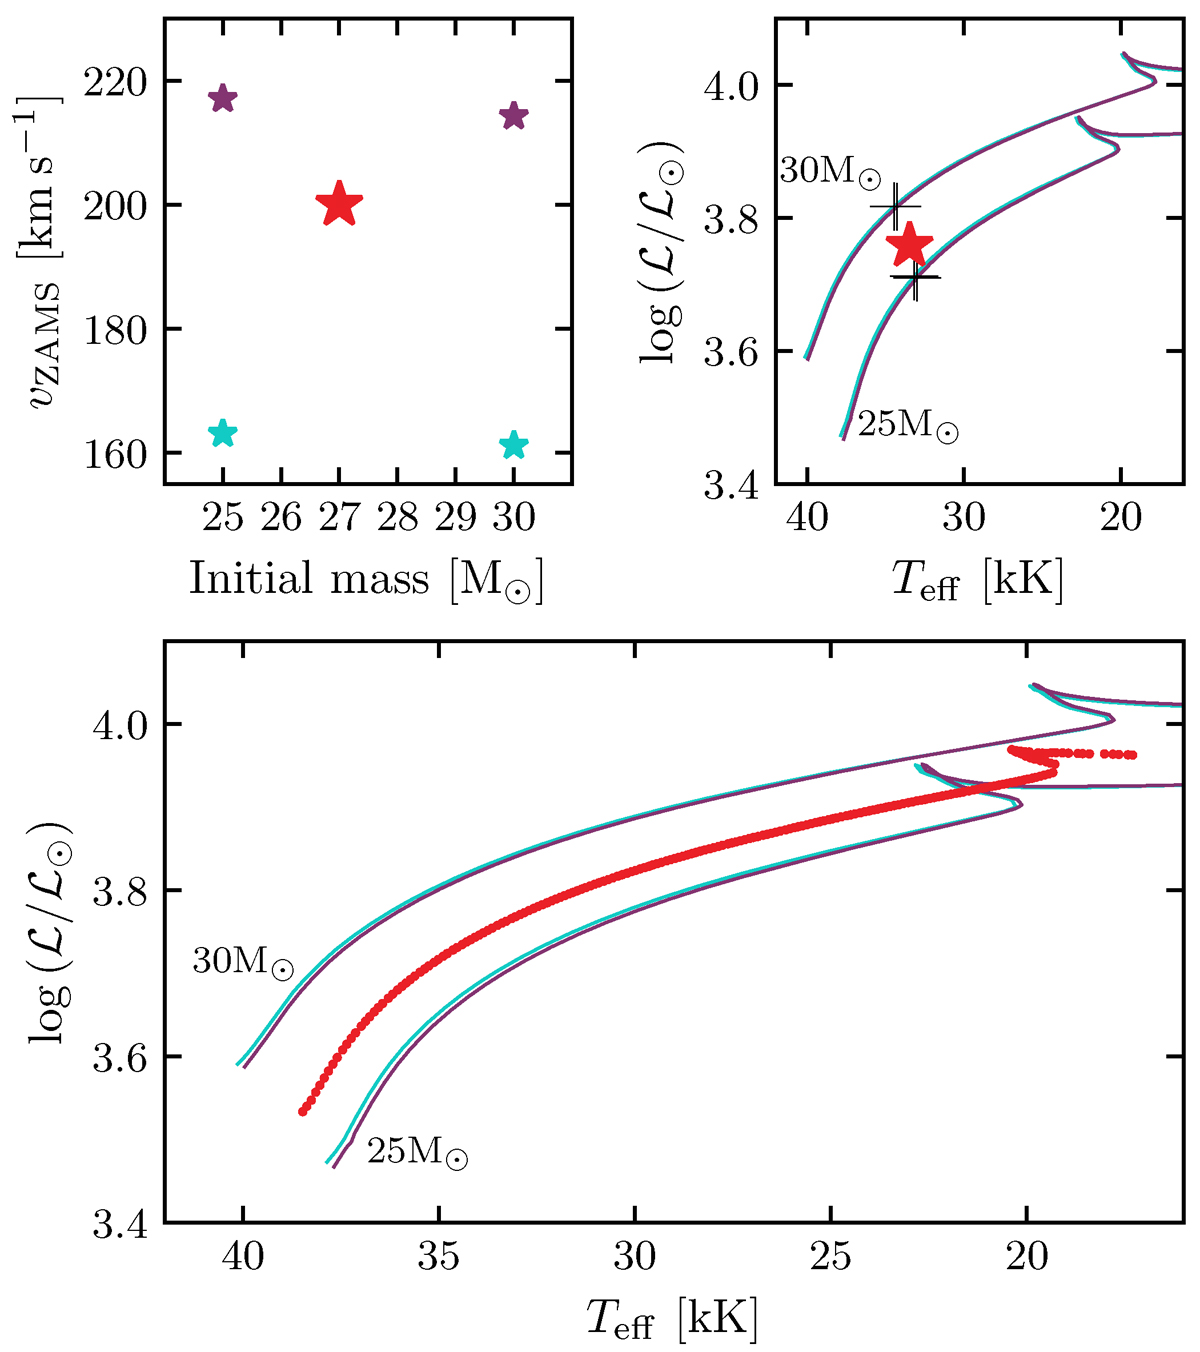
Top: Illustration of the Hōkū interpolation process. The left panel shows the initial masses and ZAMS velocities of the grid models in purple and turquoise, and the simulated star is shown in red. The right panel shows the evolutionary models in a spectroscopic HR diagram and the interpolated effective temperature and spectroscopic luminosity of the simulated star. The crosses mark where the effective temperature and spectroscopic luminosity are interpolated from the grid models. Bottom: Resulting evolutionary track of the 27 M⊙, ![]() interpolated star in a spectroscopic HR diagram, along with the grid models used for interpolation.
interpolated star in a spectroscopic HR diagram, along with the grid models used for interpolation.
Current usage metrics show cumulative count of Article Views (full-text article views including HTML views, PDF and ePub downloads, according to the available data) and Abstracts Views on Vision4Press platform.
Data correspond to usage on the plateform after 2015. The current usage metrics is available 48-96 hours after online publication and is updated daily on week days.
Initial download of the metrics may take a while.