Fig. 4.
Download original image
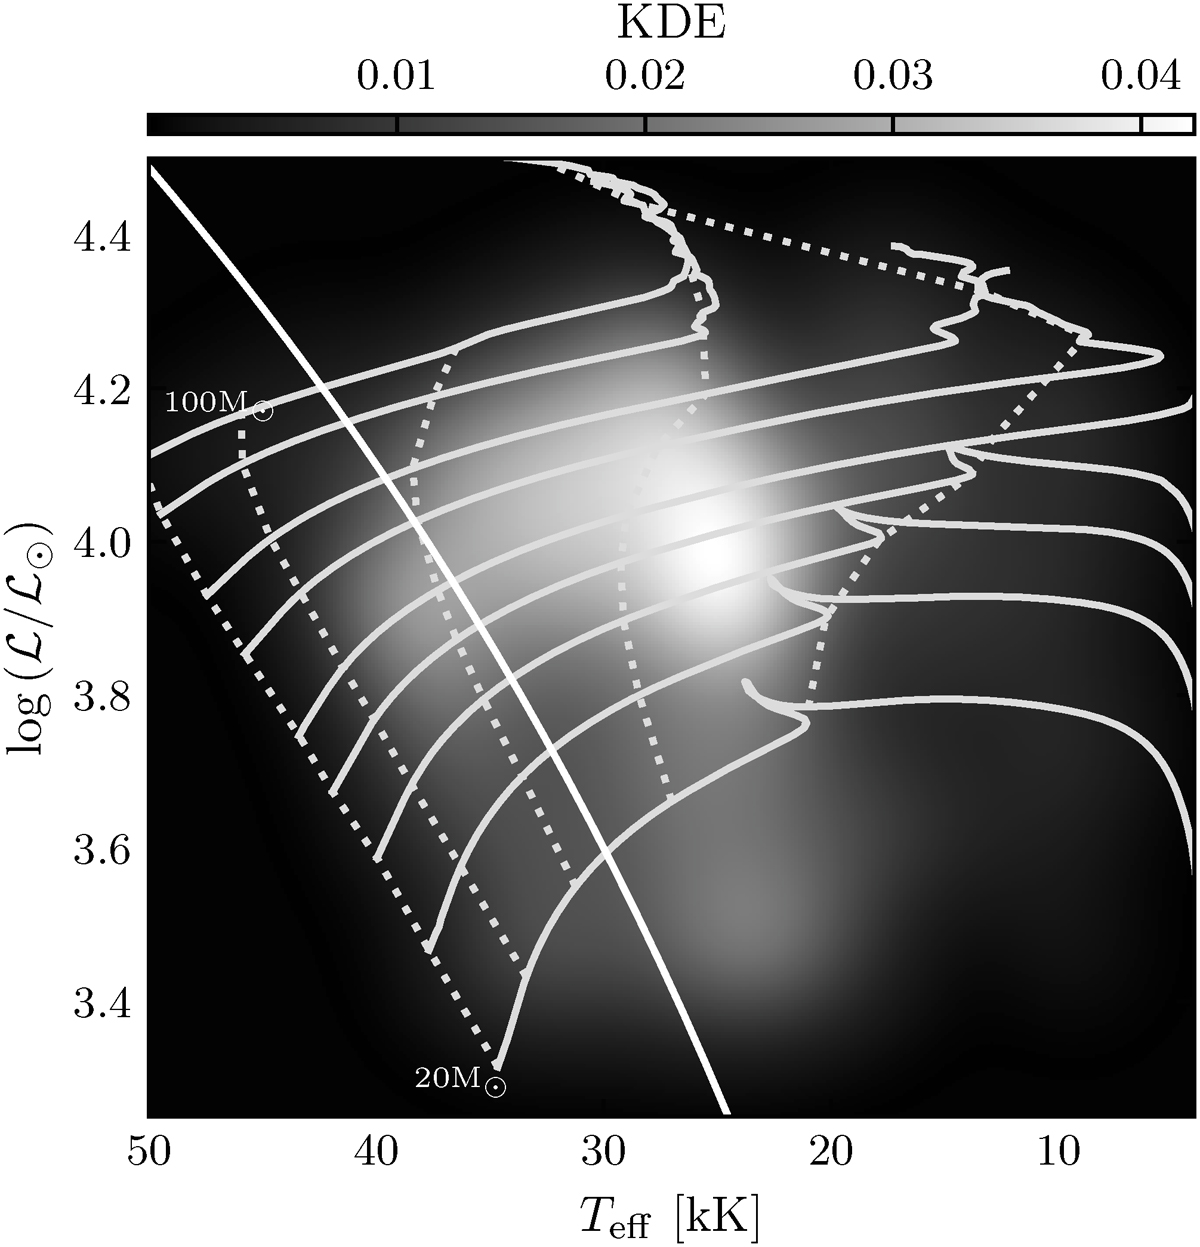
2D KDE of the entire observed sample in the sHRD (background). The solid lines show the evolutionary tracks of Brott models at 20 M⊙, 25 M⊙, 30 M⊙, 35 M⊙, 40 M⊙, 50 M⊙, 60 M⊙, 80 M⊙, and 100 M⊙ with an initial rotational velocity of 200 km s−1. The dotted lines divide the MS into quarters, determined by the fraction of the initial core hydrogen mass fraction that has been burned. The white line indicates log g = 3.7 dex. Only stars to the left of this line were used to create the initial velocity KDE discussed in Section 4.2.
Current usage metrics show cumulative count of Article Views (full-text article views including HTML views, PDF and ePub downloads, according to the available data) and Abstracts Views on Vision4Press platform.
Data correspond to usage on the plateform after 2015. The current usage metrics is available 48-96 hours after online publication and is updated daily on week days.
Initial download of the metrics may take a while.