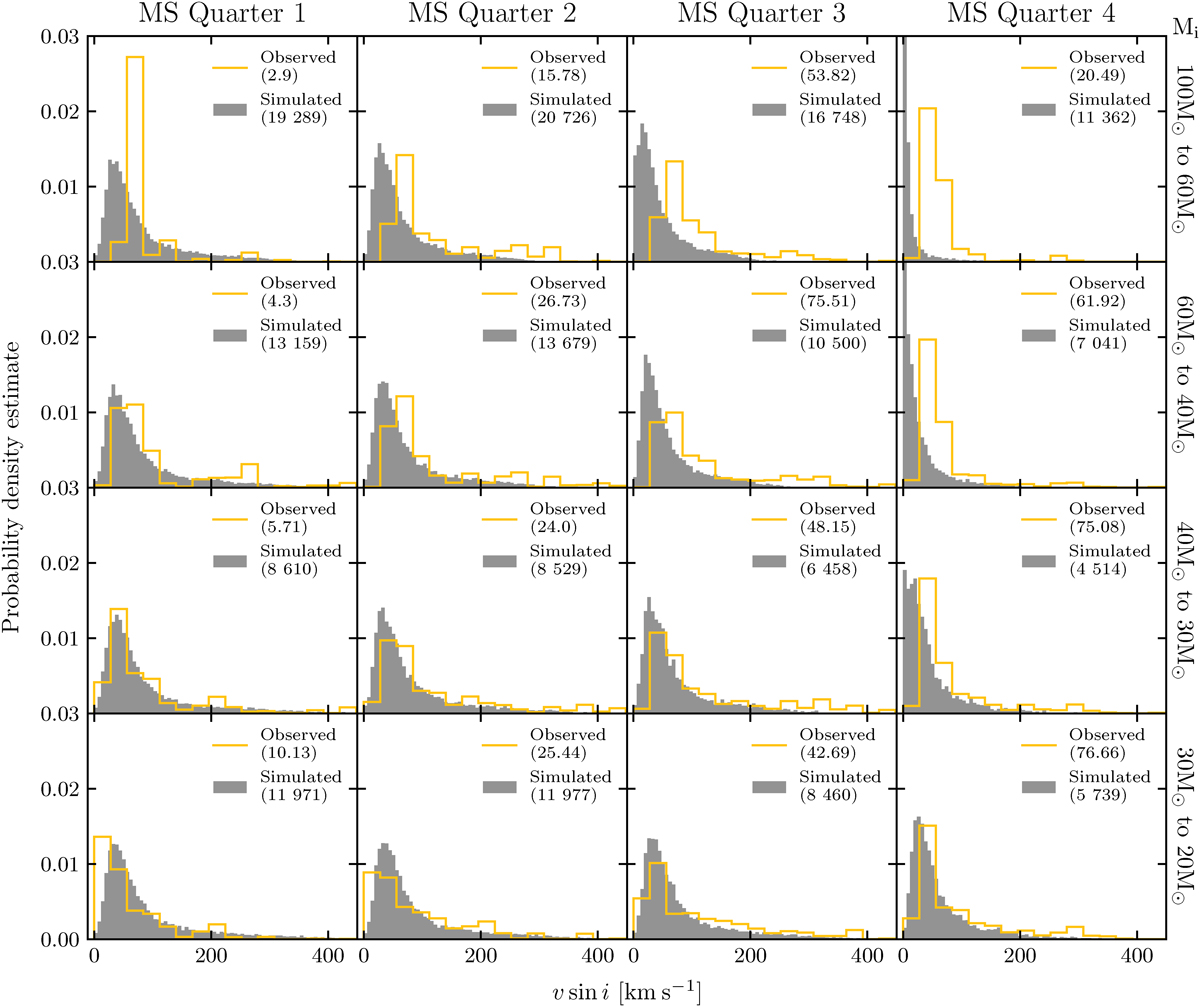
Fig. 6.
Download original image
Distributions of the projected rotational velocity, v sin i for the observed stars (yellow lines) and for the synthetic population (gray histograms), where the v sin i is calculated using the rotational velocities directly from the models of Brott et al. (2011). The four columns show the different quarters of the MS, as denoted above, and the four rows show the different mass bins, as denoted to the right. The numbers in the legends indicate the number of observed or simulated stars in the respective histograms (see Sect. 4.1). The simulated distribution reaches beyond the y-axis boundary in two panels, where for the 100–60 M⊙ mass bin, the fourth quarter reaches to 0.13, and for the 60–40 M⊙ mass bin, the fourth quarter reaches to 0.069.
Current usage metrics show cumulative count of Article Views (full-text article views including HTML views, PDF and ePub downloads, according to the available data) and Abstracts Views on Vision4Press platform.
Data correspond to usage on the plateform after 2015. The current usage metrics is available 48-96 hours after online publication and is updated daily on week days.
Initial download of the metrics may take a while.