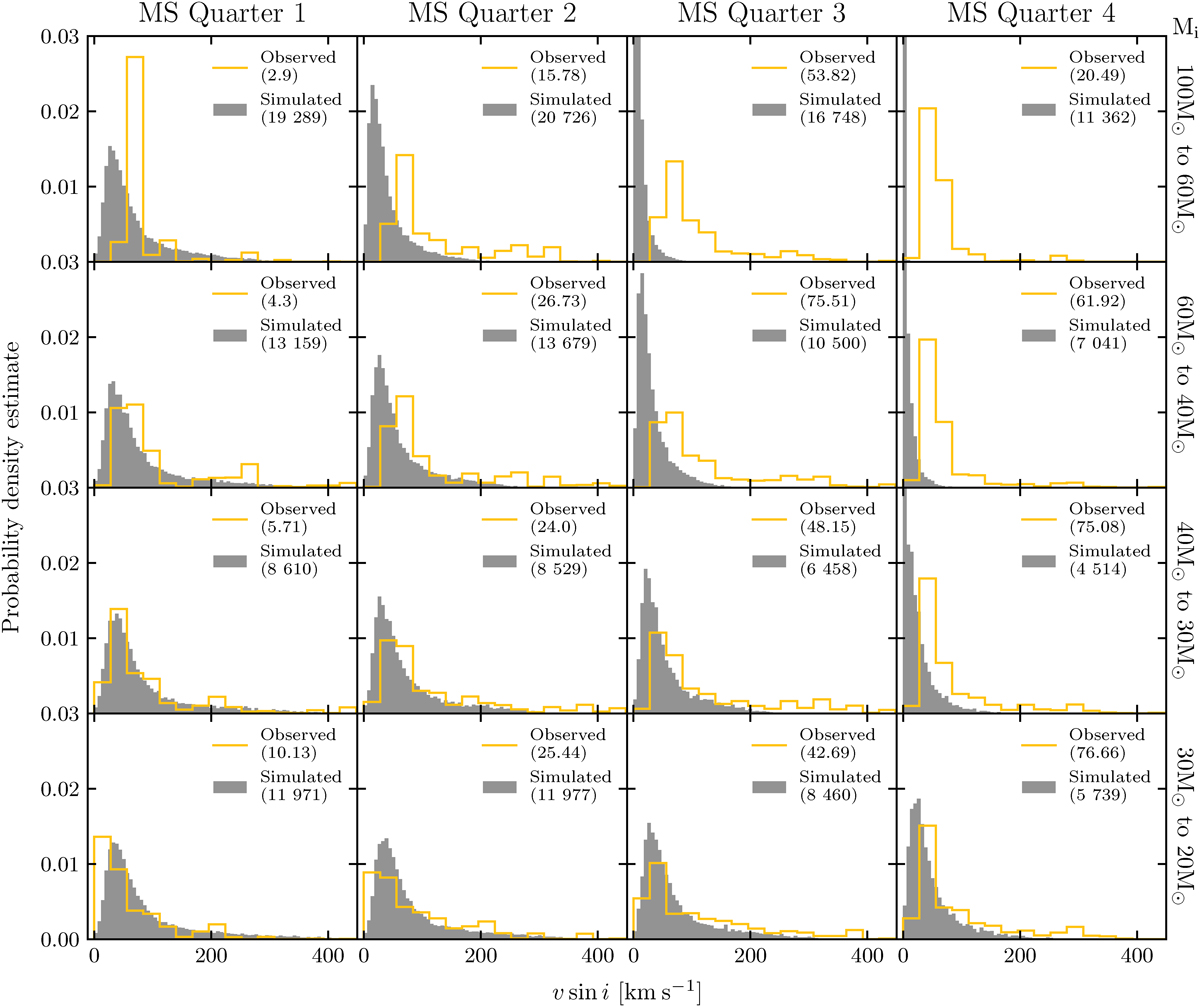
Fig. 7.
Download original image
As Fig. 6, but with v sin i values for the synthetic population calculated by applying our new angular momentum loss recipe to the models of Brott et al. (2011), as discussed in Appendix A. The simulated distribution reaches beyond the y-axis boundary in four panels. For the 60–100 M⊙ mass bin, the third quarter reaches to 0.08 and the fourth quarter reaches to 0.17. For the 40–60 M⊙ mass bin, the fourth quarter reaches to 0.12. For the 30–40 M⊙ mass bin the fourth quarter reaches to 0.05.
Current usage metrics show cumulative count of Article Views (full-text article views including HTML views, PDF and ePub downloads, according to the available data) and Abstracts Views on Vision4Press platform.
Data correspond to usage on the plateform after 2015. The current usage metrics is available 48-96 hours after online publication and is updated daily on week days.
Initial download of the metrics may take a while.