Fig. 6.
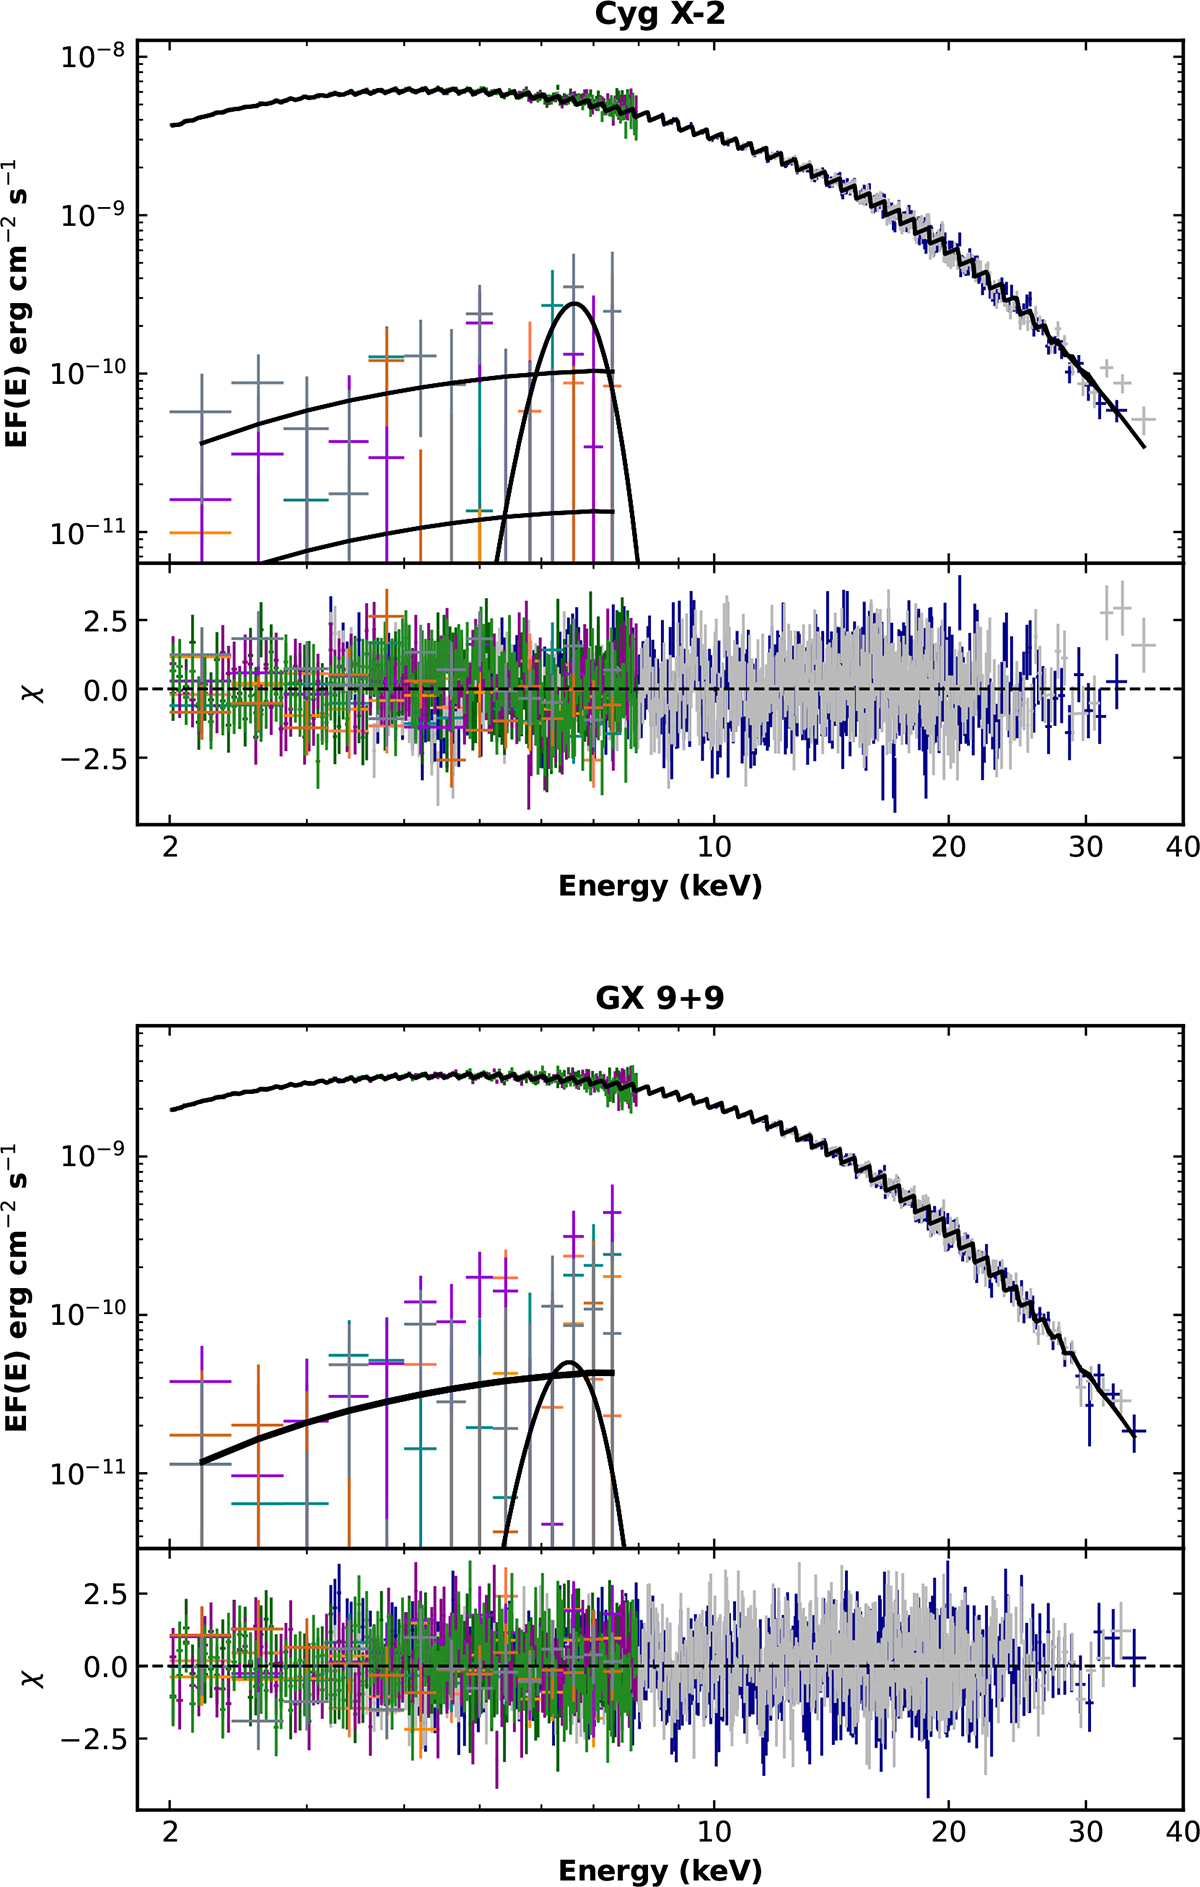
Download original image
Deconvolved EF(E) spectra of IXPE (I, Q, U) and NuSTAR of Cyg X-2 (upper panel) and GX 9+9 (lower panel) with the best-fit model reported in Table 2 superposed and residuals between data and the model in units of σ. The greater rolling angle of Cyg X-2 makes visible the U component of the bldisk spectrum in the IXPE detector reference frame.
Current usage metrics show cumulative count of Article Views (full-text article views including HTML views, PDF and ePub downloads, according to the available data) and Abstracts Views on Vision4Press platform.
Data correspond to usage on the plateform after 2015. The current usage metrics is available 48-96 hours after online publication and is updated daily on week days.
Initial download of the metrics may take a while.