Fig. 3.
Download original image
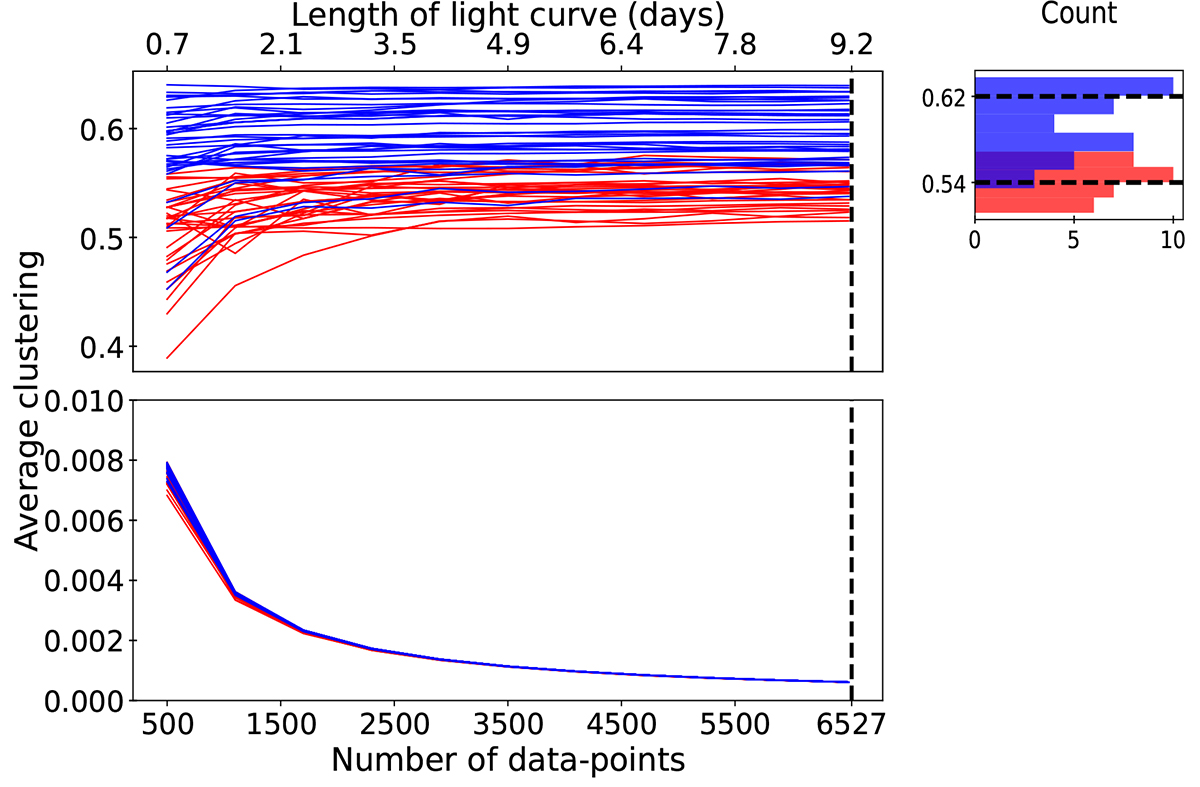
HVG average clustering coefficients versus the graph sizes for HADS (red lines), LADS (blue lines) stars in up-left panel, and for their equivalent random networks in down-left panel. The distribution of average clustering coefficients at the size of 6527 nodes shows different maximum values for HADS (0.62) and LADS (0.54) in the up-right panel.
Current usage metrics show cumulative count of Article Views (full-text article views including HTML views, PDF and ePub downloads, according to the available data) and Abstracts Views on Vision4Press platform.
Data correspond to usage on the plateform after 2015. The current usage metrics is available 48-96 hours after online publication and is updated daily on week days.
Initial download of the metrics may take a while.