Fig. 4.
Download original image
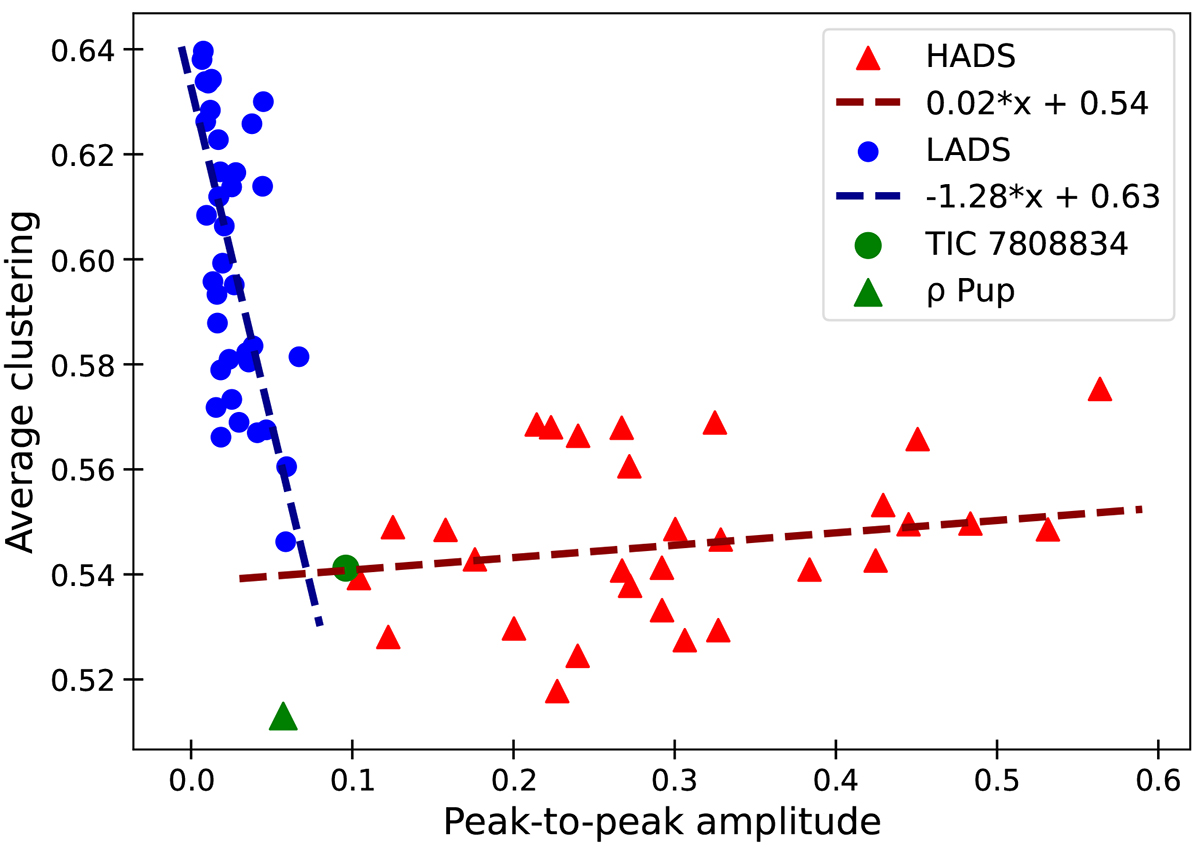
Scatter plot of HVG average clustering versus the peak-to-peak amplitude of TESS light curves can separate the HADS (red triangles) and LADS (blue circles) in two clusters. Two linear functions (dashed lines) describe the dependency of Average clustering and peak-to-peak amplitude values as morphological parameters in network and light curve respectively.
Current usage metrics show cumulative count of Article Views (full-text article views including HTML views, PDF and ePub downloads, according to the available data) and Abstracts Views on Vision4Press platform.
Data correspond to usage on the plateform after 2015. The current usage metrics is available 48-96 hours after online publication and is updated daily on week days.
Initial download of the metrics may take a while.