Open Access
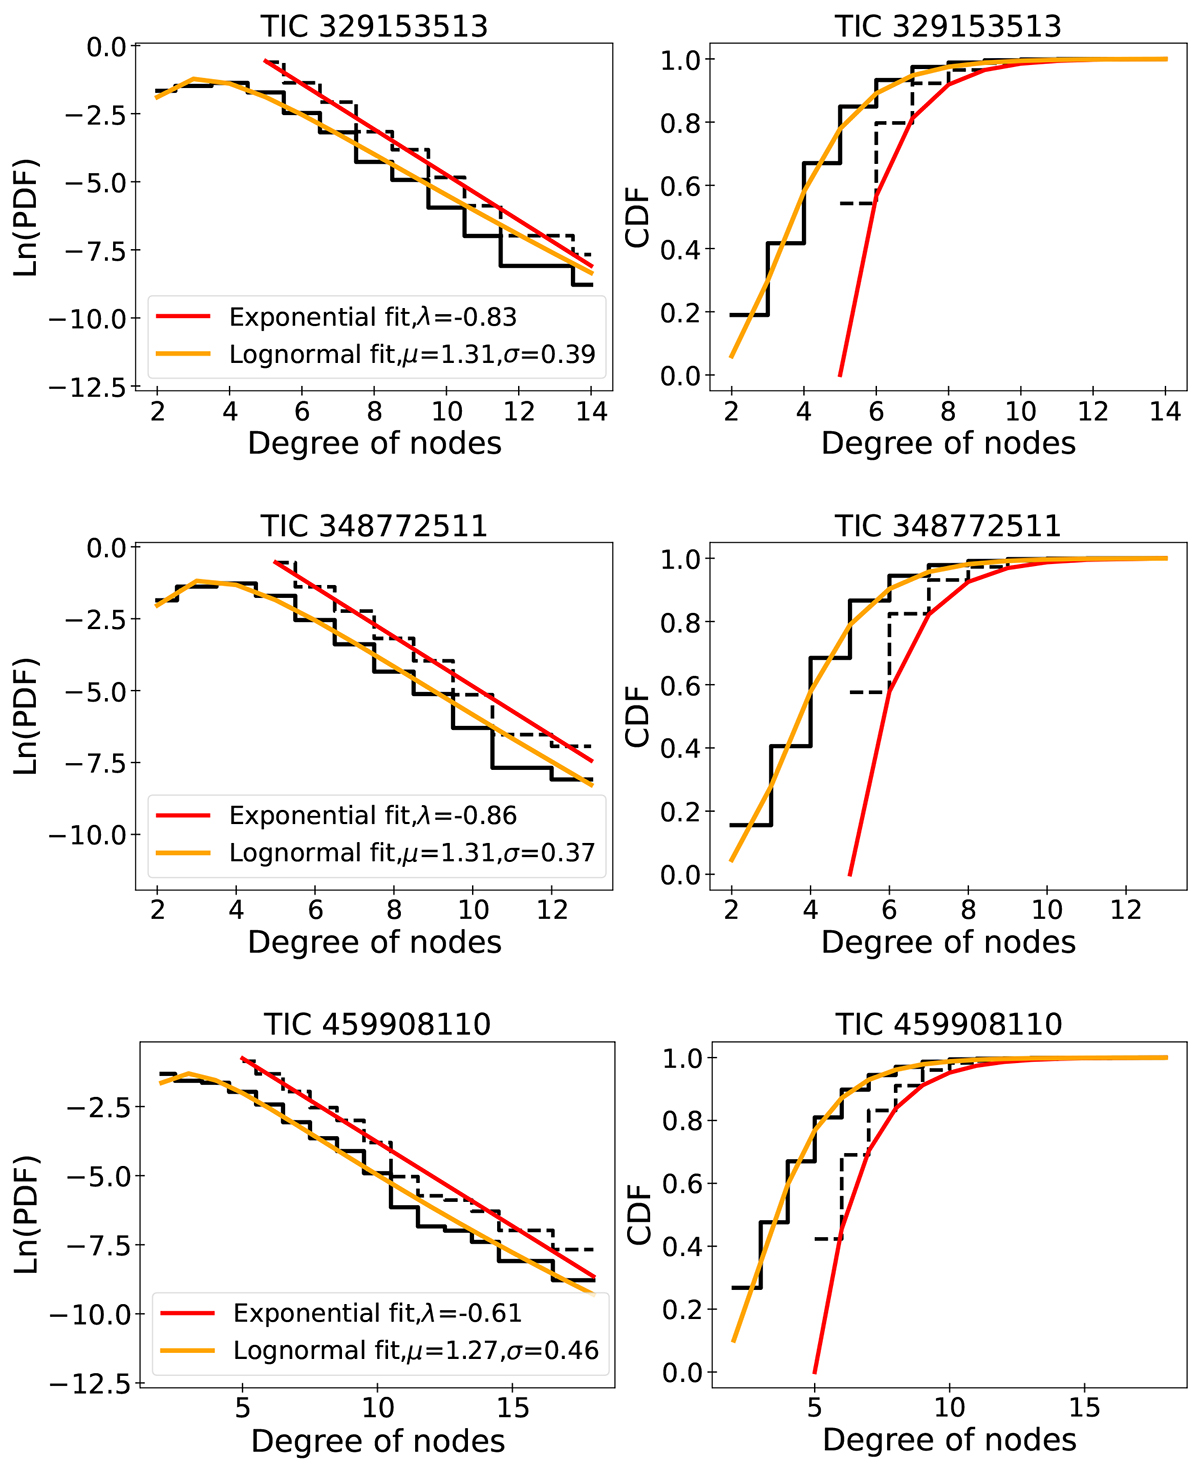
Fig. 6.
Download original image
Logarithm of PDF (first column) and CDF (second column) for the HVGs node degrees for three LADS (TIC 329153513, TIC 348772511, and TIC 459908110) stars. Exponential fits (red lines) and lognormal distributions (orange lines) are plotted on their normalised distributions in solid and dashed lines, respectively.
Current usage metrics show cumulative count of Article Views (full-text article views including HTML views, PDF and ePub downloads, according to the available data) and Abstracts Views on Vision4Press platform.
Data correspond to usage on the plateform after 2015. The current usage metrics is available 48-96 hours after online publication and is updated daily on week days.
Initial download of the metrics may take a while.