Fig. 4.
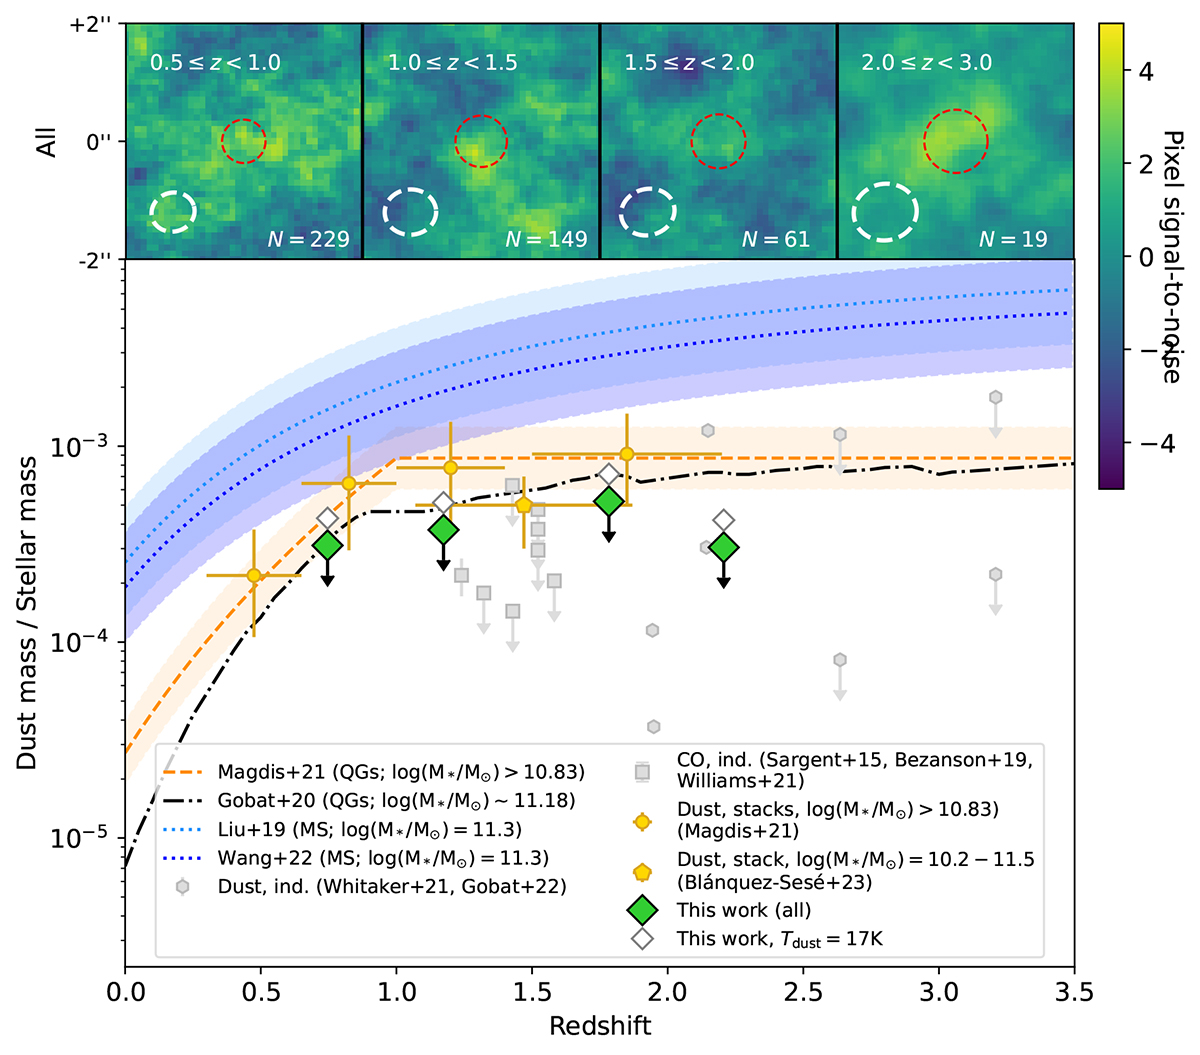
Download original image
Results of our stacking of four different redshift bins: zobs = 0.5 − 1, 1 − 1.5, 1.5 − 2, and 2 − 3. Top panel: Cutouts of the map centre. We show the profile of the synthesised beam as a dashed white shape in the bottom left, and the number of individual galaxies stacked in the bottom right. The dashed red circle in the centre shows the aperture used to measure the source emission. The colour scaling is set to reflect the signal-to-noise ratio of each pixel. Bottom panel: Dust-to-stellar mass ratio (fdust) of our stacks (green diamonds) at the weighted mean redshift of each stack in comparison to the fdust measurements of massive QGs from the literature; grey symbols show individual measurements from dust (grey hexagons) and CO (grey squares), yellow symbols the results from stacking studies, and the dashed yellow and dash-dotted black lines the predictions from data fitting. The empty diamonds show our upper limits when assuming a lower dust temperature of 17 K. The dashed blue lines and shaded regions show the fdust evolution of massive MS galaxies from Liu et al. (2019b) and Wang et al. (2022).
Current usage metrics show cumulative count of Article Views (full-text article views including HTML views, PDF and ePub downloads, according to the available data) and Abstracts Views on Vision4Press platform.
Data correspond to usage on the plateform after 2015. The current usage metrics is available 48-96 hours after online publication and is updated daily on week days.
Initial download of the metrics may take a while.