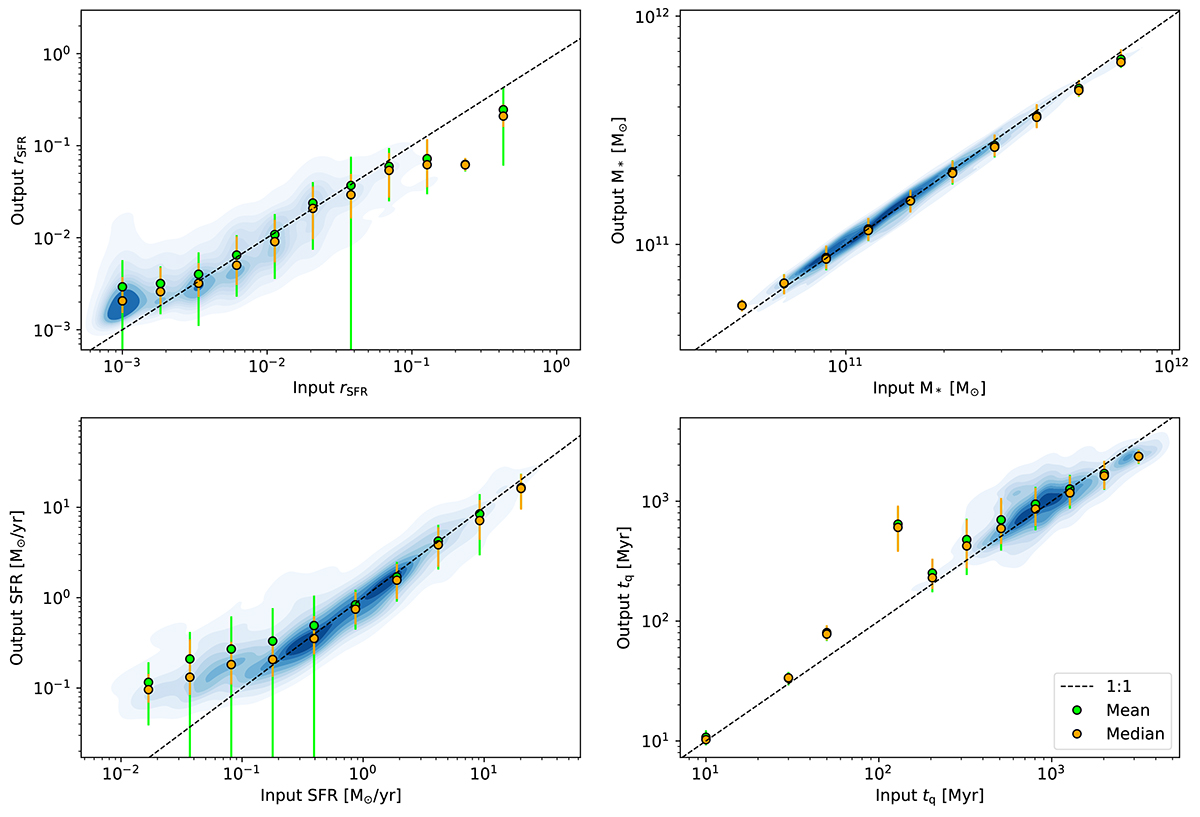
Fig. A.1.
Download original image
Results of our CIGALE mock analysis: Bayesian output parameters in relation to the known input parameters, using 100 SEDs for each galaxy that were randomly disturbed in flux. The blue shaded areas show the density of individual values in the plot. Green points and error bars show the mean and standard deviation in bins of input parameters. Orange points and error bars show the median and the 16th and 84th percentiles in the same bins. The dashed line represents a one-to-one ratio.
Current usage metrics show cumulative count of Article Views (full-text article views including HTML views, PDF and ePub downloads, according to the available data) and Abstracts Views on Vision4Press platform.
Data correspond to usage on the plateform after 2015. The current usage metrics is available 48-96 hours after online publication and is updated daily on week days.
Initial download of the metrics may take a while.