Fig. C.2.
Download original image
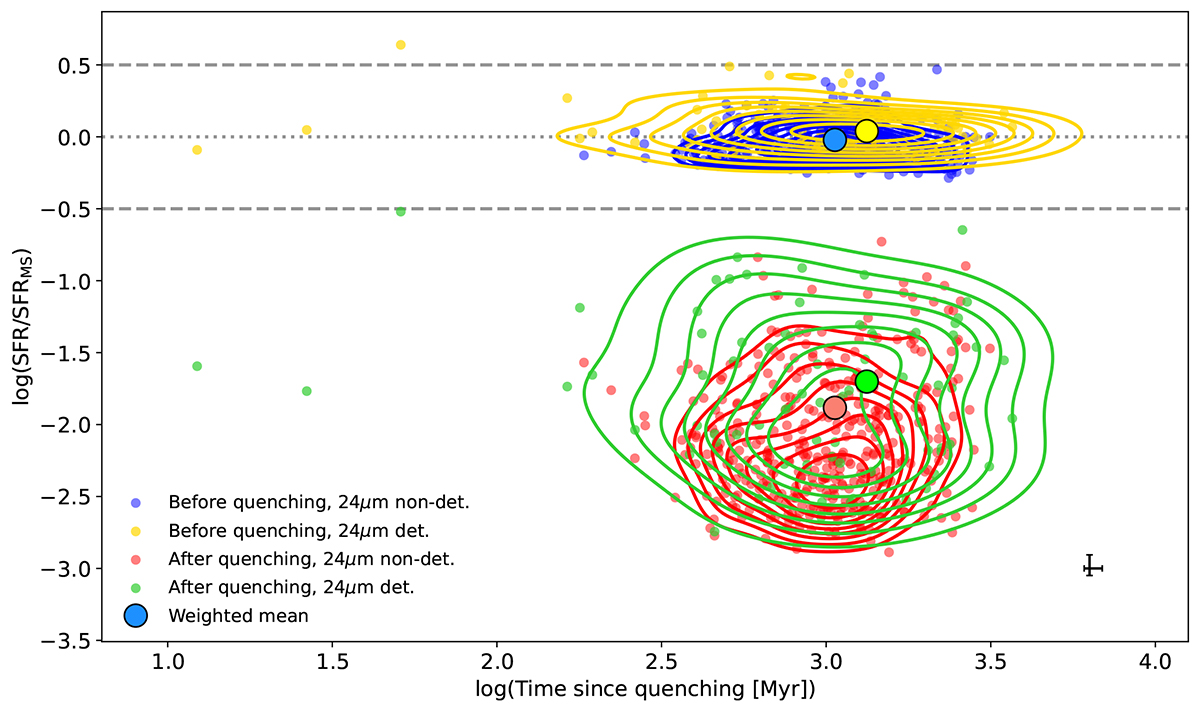
Location with respect to the Schreiber et al. (2015) MS as a function of the time since quenching for our full QG sample. Green (red) dots mark the locations of galaxies detected (undetected) in the 24 μm band after quenching, and yellow (blue) dots show the location of the same galaxies before quenching. The large symbols show the weighted mean of each group. The cross in the bottom-right corner denotes the error on the weighted mean. The coloured lines show the density distribution of each group.
Current usage metrics show cumulative count of Article Views (full-text article views including HTML views, PDF and ePub downloads, according to the available data) and Abstracts Views on Vision4Press platform.
Data correspond to usage on the plateform after 2015. The current usage metrics is available 48-96 hours after online publication and is updated daily on week days.
Initial download of the metrics may take a while.