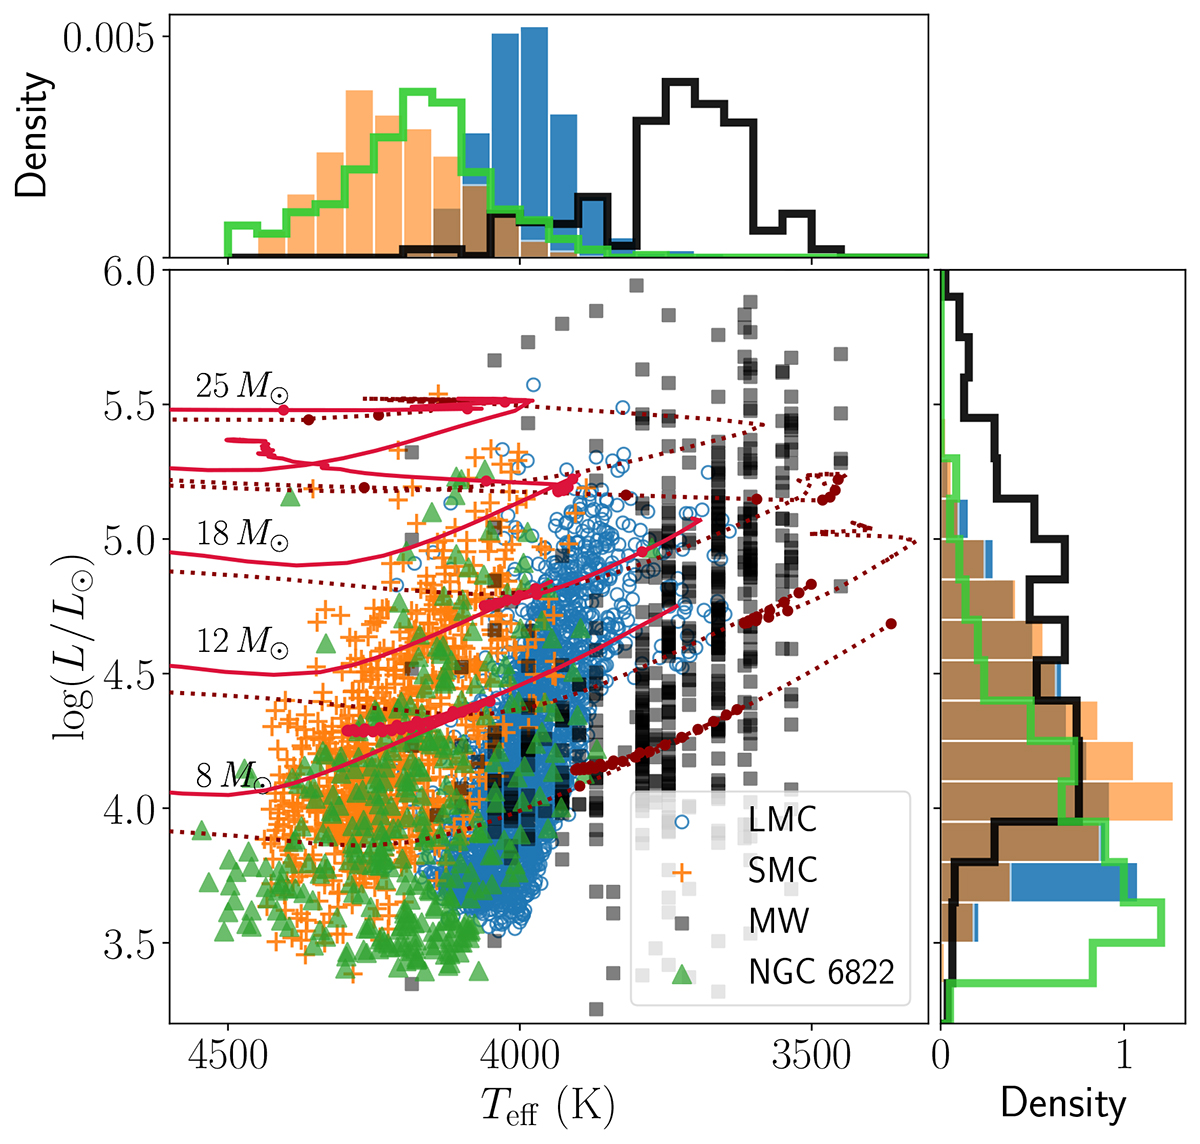
Fig. 1.
Download original image
HR diagram of the RSG samples in the LMC (blue circles), SMC (orange crosses), MW (black squares), and the NGC 6822 (green triangles). Four POSYDON evolutionary tracks for [Z]= − 0.7 and [Z] = 0 are shown in red and dotted dark red lines, respectively, and the points indicate intervals of 10 000 yr. The upper and right panels show the density histograms (areas equal to 1) of the effective temperature and luminosity, respectively.
Current usage metrics show cumulative count of Article Views (full-text article views including HTML views, PDF and ePub downloads, according to the available data) and Abstracts Views on Vision4Press platform.
Data correspond to usage on the plateform after 2015. The current usage metrics is available 48-96 hours after online publication and is updated daily on week days.
Initial download of the metrics may take a while.