Open Access
Fig. A.3.
Download original image
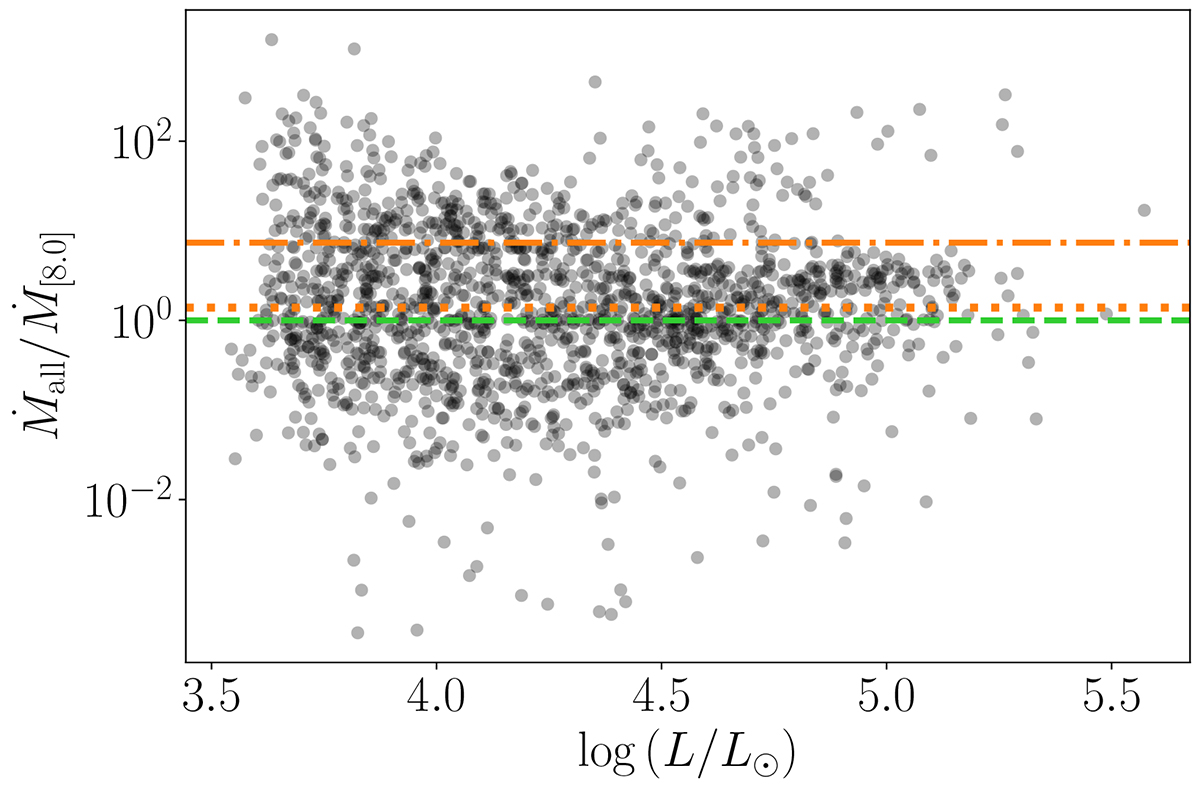
Ratio of the derived Ṁ using photometry in all bands over the derived Ṁ using photometry up to 8 μm for RSGs in the LMC. The green dashed line demonstrates the ratio of 1. The dotted and dot-dashed orange lines indicate the median (at 1.4) and mean for log(L/L⊙) > 4, respectively.
Current usage metrics show cumulative count of Article Views (full-text article views including HTML views, PDF and ePub downloads, according to the available data) and Abstracts Views on Vision4Press platform.
Data correspond to usage on the plateform after 2015. The current usage metrics is available 48-96 hours after online publication and is updated daily on week days.
Initial download of the metrics may take a while.