Fig. E.1.
Download original image
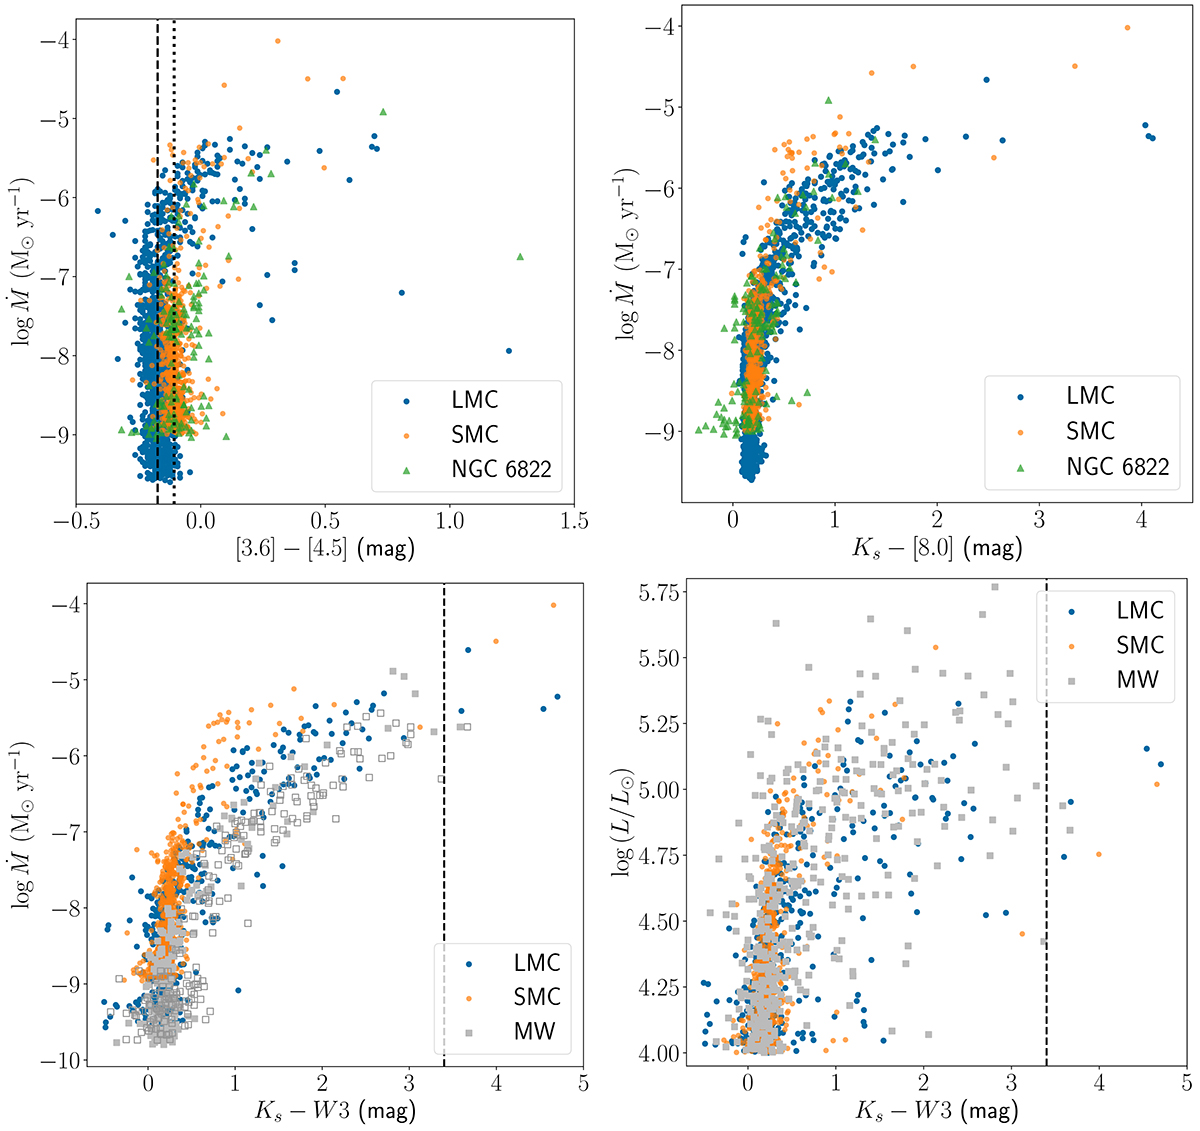
Top: Mass-loss rate as a function of colour for the LMC (blue), SMC (orange), and NGC 6822 (green triangles). The dashed and dotted vertical lines on the left panel indicate the median values at log(Ṁ/(M⊙ yr−1)) < −7 for the LMC and SMC, respectively. Bottom: Colour mass-loss rate (left) and colour luminosity (right) diagrams for the LMC (blue), SMC (orange), and MW (grey squares). The open squares indicate the more uncertain Ṁ in the MW with not well-fit JHKs photometry. The dashed vertical line shows the limit above which there are candidate dust-enshrouded RSGs.
Current usage metrics show cumulative count of Article Views (full-text article views including HTML views, PDF and ePub downloads, according to the available data) and Abstracts Views on Vision4Press platform.
Data correspond to usage on the plateform after 2015. The current usage metrics is available 48-96 hours after online publication and is updated daily on week days.
Initial download of the metrics may take a while.