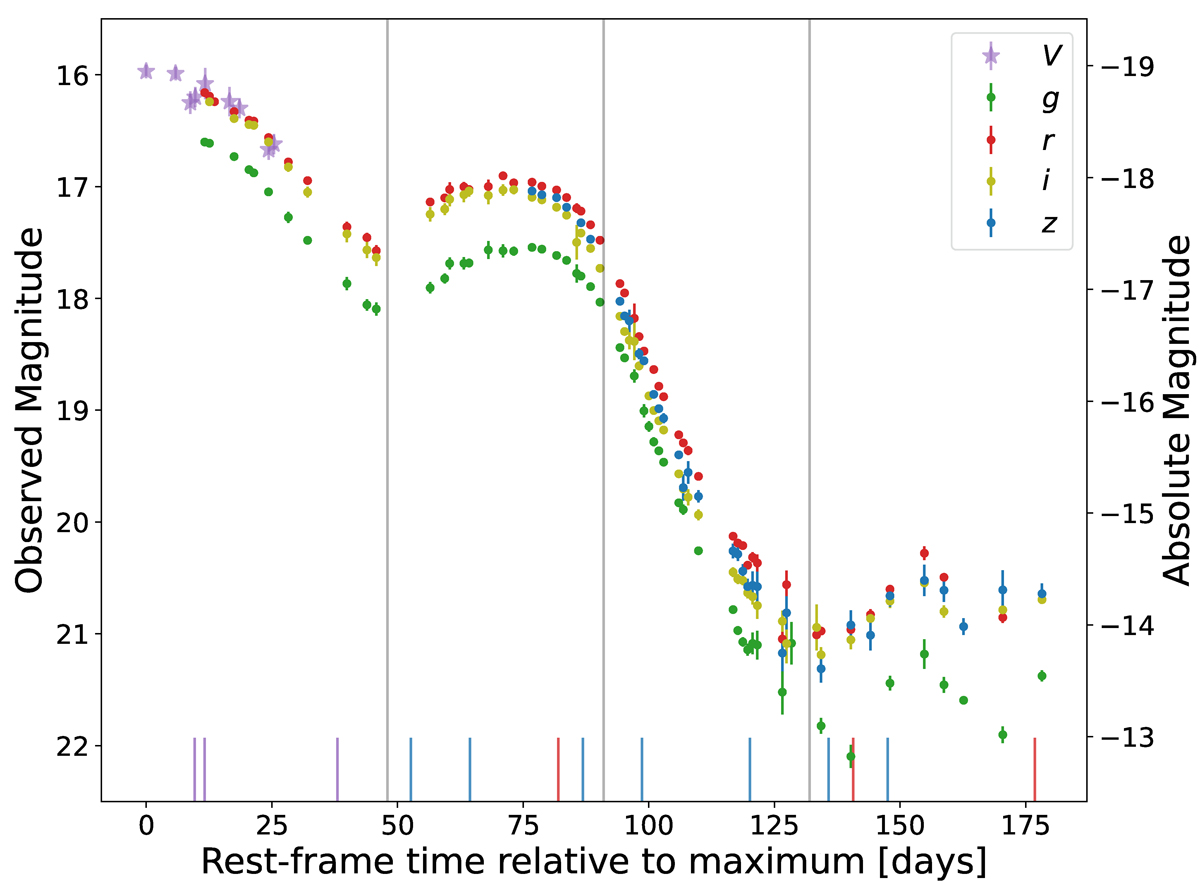
Fig. 2.
Download original image
ASASSN-13dn light curve. A secondary peak is observed ∼73 days after the first detection. In the tail of the light curve, clear signs of ejecta-CSM interaction are seen in the wiggles. The decline in slope after the secondary peak is faster than the decline after the first peak. The lines at the bottom mark the epochs where spectroscopic data are available. The vertical lines divide the light curve into the phases described in Sect. 3.1.
Current usage metrics show cumulative count of Article Views (full-text article views including HTML views, PDF and ePub downloads, according to the available data) and Abstracts Views on Vision4Press platform.
Data correspond to usage on the plateform after 2015. The current usage metrics is available 48-96 hours after online publication and is updated daily on week days.
Initial download of the metrics may take a while.