Fig. 4.
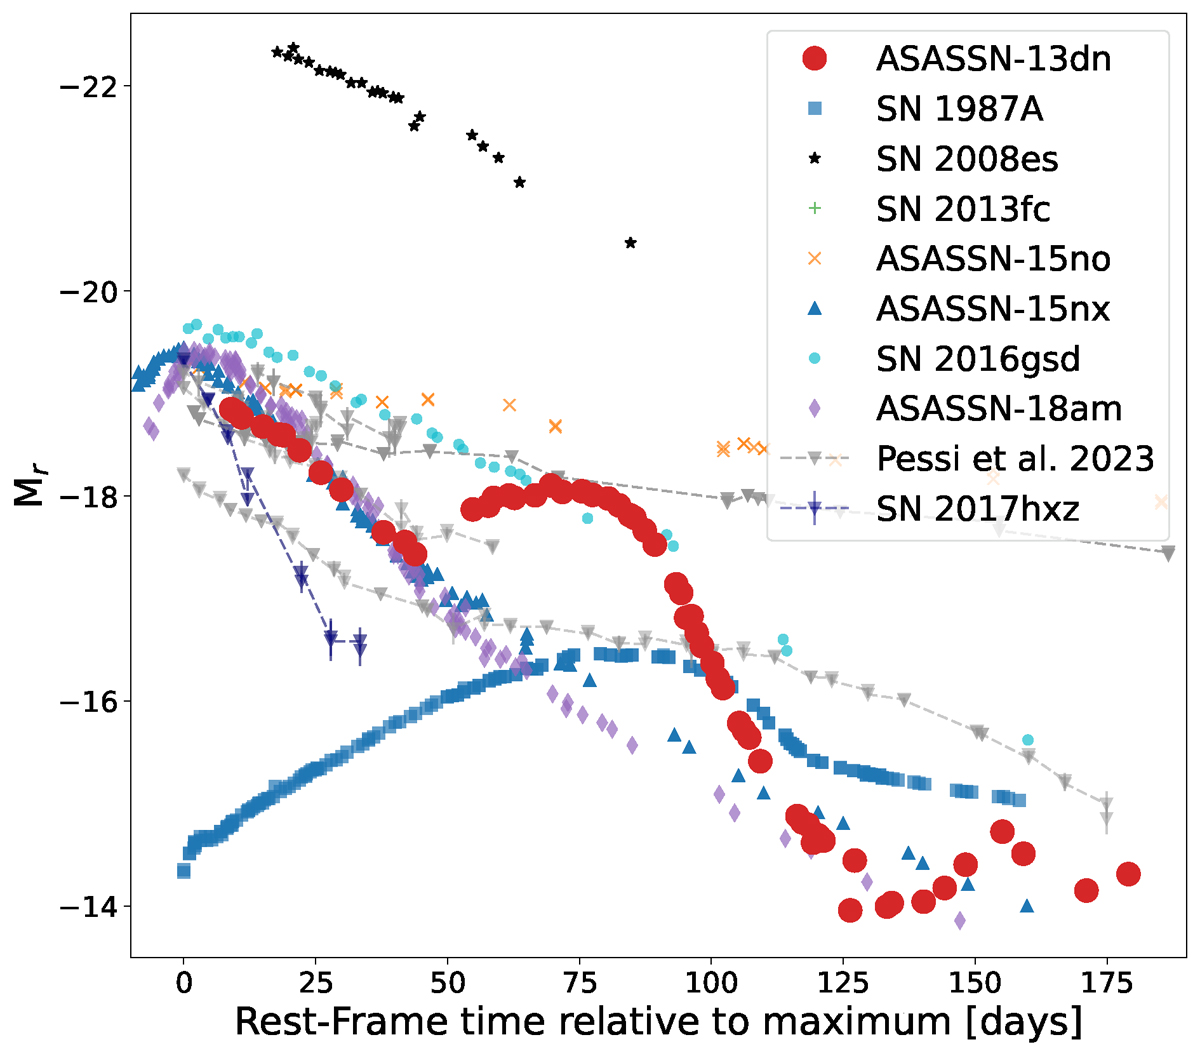
Download original image
Comparison of the r-band absolute magnitude evolution with other type II LSNe and SN 1987A. The phase is with respect to the maximum brightness. The bumps of ASASSN-13dn are not seen in other objects. The adopted maximum light date in MJD, distance (Mpc), and AV for each SN are, respectively: SN 1987A1: 49849.8, 0.05, 0.206 (Hamuy & Suntzeff 1990); SN 2008es: 54599.3, 1013.2, 0.032 (Miller et al. 2009) SN 2013fc: 56530.8, 83.2, 2.914 (Kangas et al. 2016); ASASSN-15no: 57235.5, 153.5, 0.045 (Benetti et al. 2018); ASASSN-15nx: 57219.1, 127.25, 0.22 (Bose et al. 2018) SN 2016gsd: 57662.5, 311.6, 0.254 (Reynolds et al. 2020); ASASSN-18am: 58142.6, 140.5, 0.027 (Bose et al. 2021); SN 2017cfo: 57838.0, 178.2, 0.066; SN 2017hbj: 58031.0, 75.0, 0.095; SN 2017hxz: 58070.0, 330.6, 0.128; SN 2018aql: 58206.0, 321.4, 0.052; and SN 2018eph: 58342.0, 121.8, 0.066 (Pessi et al. 2023). For SN1987A and SN2008es we used the R-band photometry. Note that the phase reported for SN 1987A is relative to the explosion and not the maximum.
Current usage metrics show cumulative count of Article Views (full-text article views including HTML views, PDF and ePub downloads, according to the available data) and Abstracts Views on Vision4Press platform.
Data correspond to usage on the plateform after 2015. The current usage metrics is available 48-96 hours after online publication and is updated daily on week days.
Initial download of the metrics may take a while.