Open Access
Fig. 2.
Download original image
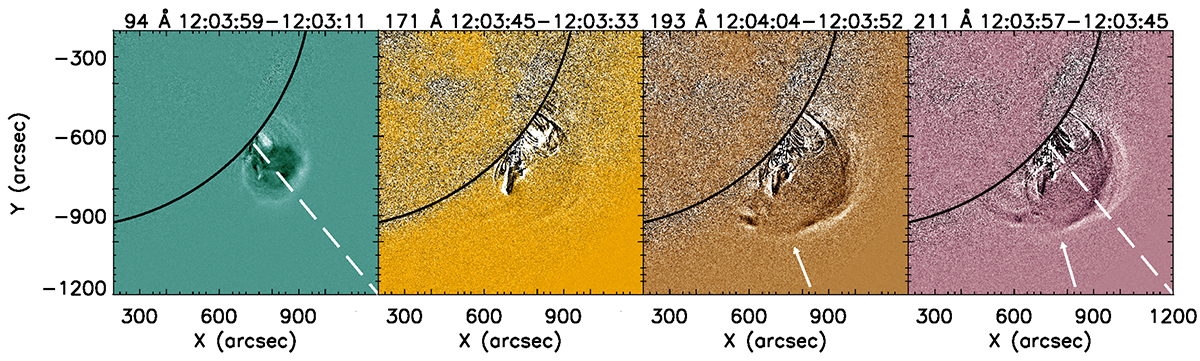
Eruptive structures observed by AIA in 94, 131, 171, and 211 Å running difference images. The dashed white line is the slit for the distance map shown in Fig. 4. The white arrow in the AIA 193 and 211 Å running difference images indicates the shock dip. A 3-second animation of this figure is available online.
Current usage metrics show cumulative count of Article Views (full-text article views including HTML views, PDF and ePub downloads, according to the available data) and Abstracts Views on Vision4Press platform.
Data correspond to usage on the plateform after 2015. The current usage metrics is available 48-96 hours after online publication and is updated daily on week days.
Initial download of the metrics may take a while.