| Issue |
A&A
Volume 702, October 2025
|
|
|---|---|---|
| Article Number | A15 | |
| Number of page(s) | 7 | |
| Section | The Sun and the Heliosphere | |
| DOI | https://doi.org/10.1051/0004-6361/202554430 | |
| Published online | 26 September 2025 | |
A wide-band high-frequency type-II solar radio burst
1
Astronomical Observatory of Jagiellonian University, Orla 171, Krakow 30-244, Poland
2
Institute of Space Sciences, Shandong University, Shandong 264209, China
⋆ Corresponding authors: This email address is being protected from spambots. You need JavaScript enabled to view it.
; This email address is being protected from spambots. You need JavaScript enabled to view it.
Received:
8
March
2025
Accepted:
23
July
2025
Abstract
Aims. Type-II radio bursts are typically observed below ∼400 MHz and are characterized by the narrowband, slowly drifting fundamental and harmonic structures. Here we report an unusual high-frequency wide-band type-II burst with a starting frequency as high as 670 MHz and an instantaneous bandwidth as wide as ∼300 MHz.
Methods. We used radio imaging from the Nançay Radio Heliograph, spectroscopic data from ORFEES, extreme-ultraviolet (EUV) observations from Solar Dynamics Observatory, and white-light observations from LASCO to determine the nature and origin of the observed radio burst as well as its propagation in the corona.
Results. The estimated average spectral drift is ∼2.18 MHz s−1, its mean duration at each frequency is ∼3 min, and the maximum brightness temperature can exceed 1011 to 1012 K. According to the simultaneous EUV and radio imaging data, the radio sources are distributed over a relatively broad region centered on a dip in the nose front of the shock-like EUV wave structure. The dip is likely caused by the strong interaction of the eruption with the overlying closed dense loops that are enclosed by the large-scale streamer structure, indicating that the type-II burst originates from coronal mass ejection shocks interacting with dense, closed-loop structures.
Conclusions. The observations suggest that the unusual wide-band high-frequency type-II radio burst originates from a dense streamer region in the corona; this is further evidenced by an EUV shock-like structure that steepens very close to the solar surface, at ∼1.23 R⊙, and the fact that the type-II radio source coincides with the shock dip. The wide-band feature is due to the source stemming from a region with significant density variations and not due to the intensity variations across the shock structure.
Key words: Sun: coronal mass ejections (CMEs) / Sun: flares / Sun: radio radiation
© The Authors 2025
 Open Access article, published by EDP Sciences, under the terms of the Creative Commons Attribution License (https://creativecommons.org/licenses/by/4.0), which permits unrestricted use, distribution, and reproduction in any medium, provided the original work is properly cited.
This article is published in open access under the Subscribe to Open model. This email address is being protected from spambots. You need JavaScript enabled to view it. to support open access publication.
1. Introduction
Type-II solar radio bursts were first identified by Payne-Scott et al. (1947). Such bursts are characterized by narrow bands drifting slowly from higher to lower frequencies according to the radio dynamic spectral data. They are associated with energetic electrons accelerated at coronal shocks (see Wild 1950; Wild & McCready 1950; Weiss 1963; Smerd 1970; Dulk 1985; Nelson & Melrose 1985 for earlier reviews). Some bursts exhibit a pair of bands that represent the fundamental and harmonic radiations according to the classical theory of plasma emission (Ginzburg & Zhelezniakov 1958). In some events, the fundamental and harmonic bands can further split into two well-separated yet morphologically similar sub-bands; these events are referred to as band-split type-II bursts (McLean 1967; Wild & Smerd 1972; Smerd et al. 1974). The exact emission processes of type-II bursts and their splitting bands are still under investigation (see, e.g., Vasanth et al. 2014; Du et al. 2014, 2015; Ni et al. 2020; Chen et al. 2022a,b).
The origin of type-II bursts and their association with eruptive structure or activities are a long-standing question (see, e.g., Reiner et al. 2003; Mancuso & Abbo 2004; Cho et al. 2007; Chen 2013; Chen et al. 2014; Vasanth & Umapathy 2013; Shanmugaraju et al. 2018; Morosan et al. 2022; Vasanth 2024; and many others). According to these earlier studies, both the shock flank and the shock nose front can act as the sources of type-II bursts. One important scenario suggests that the coronal type-II bursts (at metric-decimetric wavelengths) originate from the interaction of a coronal mass ejection (CME) with nearby dense structures such as coronal rays or streamers (Reiner et al. 2003; Mancuso & Abbo 2004; Cho et al. 2007, 2011; Chen 2013; Chen et al. 2014; Kong et al. 2015, 2016; Chrysaphi et al. 2018, 2020). Such interactions favor the generation of type-II radio bursts since they can lead to: (1) a local steepening or brightness enhancement of the shock structure since the rays or streamers are denser than their surroundings and thus have lower Alfvénic speeds, (2) a quasi-perpendicular shock geometry if the CME interacts with overlying loops or the CME impinges on the streamer or ray structure from its flank, and (3) the transit of the shock across the magnetically closed structure that forms an efficient particle trap ahead of the shock structure, leading to repetitive acceleration. Kong et al. (2012) and Chen et al. (2014) presented observational evidence of a CME–ray or CME–streamer interaction region acting as the source of a type-II burst, and in a series of numerical studies (Kong et al. 2015, 2016) verified the scenario that the shock interacting with a large-scale magnetically closed structure acts as an efficient particle accelerator and a potential type-II burst source.
Reiner et al. (2003) analyzed a type-II radio burst accompanied by two CMEs and suggested that the type-II burst is generated by the CME shock propagating through the streamer. They did not have radio imaging observations, so they could not determine the precise location of the radio source along the shock. Chrysaphi et al. (2020) analyzed a stationary to drifting structured type-II radio burst accompanied by two CMEs and concluded that a streamer-puff CME was the driver of the type-II burst and, furthermore, that the shock interacting with the streamer results in the stationary component of the type-II burst and that the later expansion of the streamer is related to the drifting component of the type-II burst. They had radio imaging from LOFAR (Low Frequency Array) observations between 45 and 30 MHz, which corresponds to a heliospheric distance of ∼ > 1.8 R⊙; they show the centroid of radio sources on the occulting disk of a CME observed with the Large Angle Spectrometric Coronagraph (LASCO) and compared it with the eruptive structure in the LASCO C2 field of view. The radio sources are located at the CME flank. Similarly, Chrysaphi et al. (2018) analyzed a band-splitting radio burst from LOFAR observations with radio imaging in the same frequency range, 45−30 MHz, which corresponds to a heliospheric distance of ∼ > 1.8 R⊙.
Thus, previous studies (Reiner et al. 2003; Chrysaphi et al. 2018, 2020) lacked radio imaging observations near the Sun. Simultaneous observations of extreme-ultraviolet (EUV) and radio imaging are available for our event. We take the advantage of the Nançay Radio Heliograph (NRH) imaging observations closer to the solar surface and provide the precise location of radio sources over the shock structure in the lower corona, as well as their streamer region, for the first time for an unusual wide-band high-frequency type-II radio burst. It is to be noted that Feng et al. (2016) analyzed the complex coronal eruption and its radio bursts, reporting a shift in radio sources from the flank to the front of the shock during propagation, which is likely due to the changes in the shock geometry at different sides of the shock during its evolution.
Type-II events with starting frequencies higher than ∼400 MHz are rare reported (e.g., Pohjolainen et al. 2008; Cho et al. 2013; Kumari et al. 2017). Such events may stem from the above mentioned CME interaction with dense coronal structures, such as streamers or rays or dense loops, or from sources that are relatively close to the solar surface.
Type-II bursts usually present narrow bands, with relative bandwidths (δf/f) of less than 0.1–0.5 (e.g, Mann et al. 1996; Vasanth et al. 2014). However, in some type-II events, the relative band width can be larger than 0.5 (e.g., Feng et al. 2015; Zimovets & Sadykov 2015; Lv et al. 2017; Morosan et al. 2022; Zhang et al. 2024). Two scenarios exist to explain the wide-band nature: (1) the burst originates from broad sources or separated locations along the front, or (2) the sources are from the transition layer across the shock, where there are large density fluctuations.
Here we report an unusual event that has both a high starting frequency and a wide band. Both EUV and radio imaging data are available, allowing us to further explore its origin. Section 2 presents the spectral and imaging data of the event. Section 3 shows the EUV and white light (WL) data of the eruption, and Sect. 4 presents the combined analysis of these data. The final section summarizes our study.
2. The radio imaging spectroscopy observation
Figure 1 presents the spectral data of the type-II burst recorded on 19 May 2022 by the ORFEES (Observations Radiospectrographiques Pour FEDOME et l′Etude des Eruptions Solaires) radio spectrograph, from 144 to 1000 MHz with a time resolution of 0.1s. The burst started at ∼12:02 UT and had a duration of ∼22 mins. The starting frequency was ∼670 MHz.
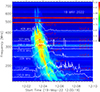 |
Fig. 1. Dynamic spectrum of the high-frequency wide-band type-II burst recorded by the ORFEES radio spectrograph (670−144 MHz). The maximum brightness temperatures (TBmax) at different NRH frequencies are plotted with white lines. |
The burst drifts downward to ∼150 MHz within ∼2.5 mins, with an average drift rate of ∼2.18 MHz s−1, measured from 11 frequency-time points. Such value agrees with earlier studies on high-frequency type-II events (e.g., Pohjolainen et al. 2008; Cho et al. 2013; Kumari et al. 2017) and are larger than those reported for typical type-II bursts starting at lower frequencies (≤1 MHz s−1; see, e.g., Mann et al. 1996; Vršnak et al. 2001; Vasanth et al. 2011, 2014; Feng et al. 2013).
The present event consists of irregular band-split signatures at the start (before 12:03:20 UT) and later (after 12:05 UT). During the main part of the burst, no such signature can be identified. During this period, the spectral band exhibits an overall enhancement as wide as 300 MHz, which is on the same order of the emission frequency. The maximum intensity appears around the middle part of the spectra, indicating that the wide-band part is not due to the splitting bands overlapping. In addition, at any specific frequency, the type-II burst lasts for ∼2 mins, which is much longer than usual bursts. These observations are very interesting since normal type-II bursts are characterized by slowly drifting narrow bands. According to the spectral data, the relative bandwidth (δf/f) is ∼1 ± 0.05 measured at ten moments between 12:03 and 12:05 UT. For instance, at 12:03:41 UT, the emission extends from ∼440 MHz to ∼180 MHz, and the central frequency is ∼300 MHz, yielding δf/f = 1.
The type-II sources were imaged by the NRH (Kerdraon & Delouis 1997) at several frequencies (408, 327, 298.7, 270.6, 228, 173.2, and 150.9 MHz). The NRH’s spatial resolution depends on the imaging frequency and time of the year, which is ∼1′–2′ at 445 MHz and ∼5′–8′ at 150.9 MHz for the present event. Its time resolution is 0.25 s, and we used 1-second integrated data for a higher signal-to-noise ratio.
The temporal profiles of the brightness temperature (TB) were obtained by the NRH. The TB reaches up to ∼1012 K at frequencies above 228 MHz. At lower frequencies, TB reaches above 1010 K. This agrees with the usual interpretation of type-II burst in terms of coherent plasma emission.
3. The EUV and WL data of the eruption
The type-II burst was associated with a CME originating from the limb according to the Atmospheric Imaging Assembly (AIA) instrument (Lemen et al. 2012) on board the Solar Dynamics Observatory (SDO; Pesnell et al. 2012) spacecraft and LASCO C2 (Brueckner et al. 1995) on board the Solar and Heliospheric Observatory (SOHO; Domingo et al. 1995). See Fig. 2 and the accompanying movie for the AIA data at 171, 193, 211, and 94 Å. The CME originated from the backside of the Sun, and the source active region (NOAA AR 13006) and overlying loops were well observed several days ago (see Fig. 3).
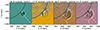 |
Fig. 2. Eruptive structures observed by AIA in 94, 131, 171, and 211 Å running difference images. The dashed white line is the slit for the distance map shown in Fig. 4. The white arrow in the AIA 193 and 211 Å running difference images indicates the shock dip. A 3-second animation of this figure is available online. |
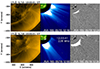 |
Fig. 3. Top: Source active region observed on the solar limb in LASCO C2 images with possible CME–streamer interaction regions. Bottom: Eruptive structure on the day of the type-II burst in LASCO images. The radio sources are represented by the 50%, 70%, and 90% contours of the corresponding TBmax. |
The early stage of the CME was well observed by AIA. The ejecta is associated with a highly writhed multi-thermal structure, as seen from the hot 94 Å passband, the warm passbands at 211, 193, and 171 Å, and the cool 304 Å passband (not shown here). The EUV wave front appears ahead of the ejecta in the running difference images at 193 and 211 Å (see Fig. 2 and the accompanying movie). The wave structure steepens after 12:02 UT. To evaluate the speeds of the EUV wave and the underlying ejecta, we plotted the height-time maps along the given slit with the 211 and 94 Å data (Fig. 4). The fitted average speed of the 94 Å ejecta is ∼ 703 ± 70 km s−1, and that of the EUV wave is ∼ 868 ± 120 km s−1 according to the 211 Å data.
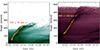 |
Fig. 4. Distance-time maps along the slice (plotted in Fig. 2) observed at AIA 94 and 211 Å. The velocities were determined via linear fittings to the distance-time profiles. |
The eruption appears in the LASCO C2 field of view at 12:24 UT. Bright and dense loops underlie a bright streamer structure, according to the AIA and LASCO C2 data, right before the eruption and four days ago (see Fig. 3). So the CME originates from the magnetically closed-loop system that is enclosed by the large-scale streamer. A strong CME-shock interaction with these overlying loops and the larger streamer structure must occur later.
4. Combined analysis
In Fig. 3 we plot the type-II sources at 12:03:41 UT onto the EUV-WL bright images. The sources are associated with the bright and dense loops underlying the streamer structure, as mentioned.
In Fig. 5 and the accompanying movie, we present the radio sources observed by NRH with the 80, 90, and 95% contour levels of the corresponding maximum TB (TBmax, indicated in each panel) at the given NRH frequencies. Only sources with TBmax > 108 K are included, to avoid interference from weaker emission. The burst appears at 408 MHz after 12:02 UT; sources at several frequencies appear together during most time of the burst due to its wide band feature. See Fig. 5 for one such moment at 12:03:41 UT, at which the type-II sources extend from 408 to 228 MHz. The NRH sources gradually moving outward, in line with the slowly drifting feature of the spectra.
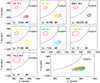 |
Fig. 5. Type-II radio sources observed by NRH at different frequencies at 12:03:41 UT. The radio sources are represented by the 80 %, 90 %, and 95 % contours of the corresponding TBmax. The last panel compares the various radio sources at different NRH channels observed at 12:03:41 UT. The red ellipse represents the beam shape at different NRH frequencies. The beam size is about ∼53 arcsecs at 408 MHz, ∼66 arcsecs at 327 MHz, ∼ 73 arcsecs at 298.7 MHz, ∼80 arcsecs at 270.6 MHz, ∼95 arcsecs at 228 MHz, ∼125 arcsecs at 173.2 MHz, and ∼144 arcsecs at 150.9 MHz along the major axis, and is about ∼39 arcsecs at 408 MHz, ∼49 arcsecs at 327 MHz, ∼53 arcsecs at 298.7 MHz, ∼59 arcsecs at 270.6 MHz, ∼70 arcsecs at 228 MHz, ∼92 arcsecs at 173.2 MHz, and ∼105 arcsecs at 150.9 MHz along the minor axis. A 22-second animation of this figure is available online. |
To further reveal the relation of NRH sources with the EUV shock wave, in Fig. 6 we overplot the 90 and 95% contours of TBmax onto the closest-in-time AIA 211 Å running difference images. We make four observations: (1) the type-II sources are co-spatial with the nose front of the EUV shock wave structure (being slightly separated, by ∼0.01 R⊙); (2) the sources basically overlap with each other before 12:04 UT (without spatial separation ∼0.001 R⊙); later they become spatially dispersed, with lower-frequency sources being farther away from the disk; (3) as already mentioned, the sources at several frequencies can appear simultaneously, and they are distributed within a broad region of ∼ 150 × 200 arcsecs; and (4) during most time of the burst, its sources are spatially dispersed yet centered around the dip region of the shock front, according to Fig. 6; the dip corresponds to the transit of the CME shock across the bright dense loop tops, according to Figs. 3 and 6.
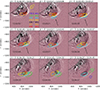 |
Fig. 6. Temporal evolution of NRH radio sources superposed onto the closest-in-time AIA 211 Å images. The radio sources are represented by the 90% and 95% of the TBmax contours. A 16-second animation of this figure is available online. |
5. Conclusions and discussion
We report an unusual high-frequency wide-band type-II solar radio burst. It starts from ∼670 MHz, with an instantaneous bandwidth of ∼300 MHz, and the relative bandwidth is as large as ∼1 ± 0.05. The burst sources are distributed within a broad region of ∼150 × 200 arcsecs and are centered around a dip region along the EUV shock wave front.
The dip is likely due to the strong compression caused by the shock propagation into bright and dense loops where the Alfvénic speed is relatively low, so is the shock speed. According to the EUV and WL data, bright and dense loops that connect the two spots are spatially correlated with the shock dip, indicating the shock has transited across them with a strong interaction or compression that leads to the type-II burst. In this case, the generation of efficient electron acceleration and type-II bursts should be related to the shock transit across these magnetically closed-loop structures. This is in line with a series of numerical studies by Kong et al. (2015, 2016). To illustrate such a scenario, we present a sketch in Fig. 7 that shows the shock transit across the loop system, the accompanying shock and its dip, the type-II sources, and the overlying large-scale helmet streamer.
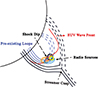 |
Fig. 7. Sketch of the shock-loop system with the dip region and the corresponding type-II radio sources. |
The burst has a high starting frequency since it originates from a dense region in the corona. This is consistent with the following two aspects of our observations: (1) according to the AIA 94 and 211 Å data, the EUV shock-like structure steepens at ∼1.23 R⊙, that is, very close to the solar surface; and (2) the type-II source coincides with the shock dip that forms since the shock transits a region denser than its surroundings (along the shock front), where the Alfvénic speed becomes lower, as does the local propagation speed of the shock.
The wide-band feature of the type-II burst means that the sources stem from a region with a large density variation; either the density fluctuations of the source have large amplitudes or the source extends over a broad, highly inhomogeneous region. Our observations favor the latter scenario: that the wide-band type-II burst stems from the broad sources centered around the shock dip, meaning larger-than-surrounding plasma densities are being sampled by the coherent emission process.
Unfortunately, with the available data we cannot tell whether the burst belongs to the fundamental or harmonic branch. Yet, based on the high starting frequency, the strong scattering or absorption effect of the fundamental plasma emission (Melrose 1970), and earlier studies indicating that in the corona the harmonic branch is usually stronger (Roberts 1959; Cliver et al. 1999; Gopalswamy 2000; Chernov & Fomichev 2021 and Pohjolainen & Talebpour Sheshvan 2021), we suggest that the burst represents the harmonic branch. At 12:03:41 UT, the upper and lower frequencies of the burst are ∼440 and 180 MHz, respectivley. Then, the type-II source densities at 12:03:41 UT should vary from ∼109 to 108 cm−3. Note that the ratio of these densities is about 10, much larger than the largest-possible compression ratio of a magnetohydrodynamic shock. This indicates that the wide-band feature is not due to density variations across the shock layer. Further studies on similar wide-band type-II bursts are desired for deeper understanding of their origin.
Data availability
Movies associated with Figs. 2, 5, 6 are available at https://www.aanda.org
Acknowledgments
This work was supported by POB Anthropocene research program of Jagiellonian University, Krakow, Poland. Yao Chen acknowledges the NNSFC grant 42127804 and G. Michalek acknowledges the support under Grant 2023/49/B/ST9/00142 by the National Science Centre, Poland. We thank the ORFEES, NRH, SOHO, NOAA teams for providing the data.
References
- Brueckner, G. E., Howard, R. A., Koomen, M. J., et al. 1995, Sol. Phys., 162, 357 [NASA ADS] [CrossRef] [Google Scholar]
- Chen, Y. 2013, Chin. Sci. Bull., 58, 1599 [Google Scholar]
- Chen, Y., Du, G. H., Feng, L., et al. 2014, ApJ, 787, 59 [NASA ADS] [CrossRef] [Google Scholar]
- Chen, Y., Zhang, Z., Ni, S., et al. 2022a, Phys. Plasmas, 29, 112113 [Google Scholar]
- Chen, Y., Zhang, Z., Ni, S., et al. 2022b, ApJ, 924, L34 [Google Scholar]
- Chernov, G., & Fomichev, V. 2021, ApJ, 922, 82 [Google Scholar]
- Cho, K.-S., Lee, J., Moon, Y.-J., et al. 2007, A&A, 461, 1121 [NASA ADS] [CrossRef] [EDP Sciences] [Google Scholar]
- Cho, K.-S., Bong, S.-C., Moon, Y.-J., et al. 2011, A&A, 530, A16 [NASA ADS] [CrossRef] [EDP Sciences] [Google Scholar]
- Cho, K.-S., Gopalswamy, N., Kwon, R.-Y., Kim, R.-S., & Yashiro, S. 2013, ApJ, 765, 148 [NASA ADS] [CrossRef] [Google Scholar]
- Chrysaphi, N., Kontar, E. P., Holman, G. D., et al. 2018, ApJ, 868, 79 [NASA ADS] [CrossRef] [Google Scholar]
- Chrysaphi, N., Reid, H. A. S., & Kontar, E. P. 2020, ApJ, 893, 115 [NASA ADS] [CrossRef] [Google Scholar]
- Cliver, E. W., Webb, D. F., & Howard, R. A. 1999, Sol. Phys., 187, 89 [NASA ADS] [CrossRef] [Google Scholar]
- Domingo, V., Fleck, B., & Poland, A. I. 1995, Sol. Phys., 162, 1 [Google Scholar]
- Du, G. H., Chen, Y., Lv, M. S., et al. 2014, ApJ, 793, L39 [NASA ADS] [CrossRef] [Google Scholar]
- Du, G. H., Kong, X. L., Chen, Y., et al. 2015, ApJ, 812, 52 [NASA ADS] [CrossRef] [Google Scholar]
- Dulk, G. A. 1985, ARA&A, 23, 169 [Google Scholar]
- Feng, S. W., Chen, Y., Kong, X. L., et al. 2013, ApJ, 767, 29 [Google Scholar]
- Feng, S. W., Du, G. H., Chen, Y., et al. 2015, Sol. Phys., 290, 1195 [NASA ADS] [CrossRef] [Google Scholar]
- Feng, S. W., Chen, Y., Song, H. Q., et al. 2016, ApJ, 827, L9 [Google Scholar]
- Ginzburg, V. L., & Zhelezniakov, V. V. 1958, Sov. Ast., 2, 653 [NASA ADS] [Google Scholar]
- Gopalswamy, N. 2000, Geophys. Mono. Ser., 119, 123 [Google Scholar]
- Kerdraon, A., & Delouis, J.-M. 1997, Coronal Physics from Radio and Space Observations, 192 [Google Scholar]
- Kong, X. L., Chen, Y., Li, G., et al. 2012, ApJ, 750, 158 [NASA ADS] [CrossRef] [Google Scholar]
- Kong, X., Chen, Y., Guo, F., et al. 2015, ApJ, 798, 81 [Google Scholar]
- Kong, X., Chen, Y., Feng, S., et al. 2016, ApJ, 830, 37 [Google Scholar]
- Kumari, A., Ramesh, R., Kathiravan, C., & Gopalswamy, N. 2017, ApJ, 843, 10 [Google Scholar]
- Lecacheux, A. 2000, Geophys. Mono. Ser., 119, 321 [Google Scholar]
- Lemen, J. R., Title, A. M., Akin, D. J., et al. 2012, Sol. Phys., 275, 17 [Google Scholar]
- Lv, M. S., Chen, Y., Li, C. Y., et al. 2017, Sol. Phys., 292, 1 [NASA ADS] [CrossRef] [Google Scholar]
- Mancuso, S., & Abbo, L. 2004, A&A, 415, L17 [NASA ADS] [CrossRef] [EDP Sciences] [Google Scholar]
- Mann, G., Klassen, A., & Classen, T. 1996, A&A, 119, 489 [Google Scholar]
- McLean, D. J. 1967, PASA, 1, 47 [Google Scholar]
- Melrose, D. B. 1970, Aus. J. Phys., 23, 871 [Google Scholar]
- Morosan, D. E., Pomoell, J., Kumari, A., et al. 2022, A&A, 668, A15 [NASA ADS] [CrossRef] [EDP Sciences] [Google Scholar]
- Nelson, G. J., & Melrose, D. B. 1985, in Solar Radiophysics, eds. D. J. McLean, & N. R. Labrum (Cambridge: Cambridge Univ. Press), 333 [Google Scholar]
- Ni, S., Chen, Y., Li, C., et al. 2020, ApJ, 891, L25 [NASA ADS] [CrossRef] [Google Scholar]
- Payne-Scott, R., Yabsley, D. E., & Bolton, J. G. 1947, Nature, 160, 256 [NASA ADS] [CrossRef] [Google Scholar]
- Pesnell, W. D., Thompson, B. J., & Chamberlin, P. C. 2012, Sol. Phys., 275, 3 [Google Scholar]
- Pohjolainen, S., & Talebpour Sheshvan, N. 2021, Sol. Phys., 296, 81 [NASA ADS] [CrossRef] [Google Scholar]
- Pohjolainen, S., Pomoell, J., & Vainio, R. 2008, A&A, 490, 357 [NASA ADS] [CrossRef] [EDP Sciences] [Google Scholar]
- Reiner, M. J., Vourlidas, A., Cyr, O. C. S., et al. 2003, ApJ, 590, 533 [Google Scholar]
- Roberts, J. A. 1959, Australian. J. Phys., 12, 327 [Google Scholar]
- Shanmugaraju, A., Suresh, K., Vasanth, V., et al. 2018, Ap&SS, 363, 126 [Google Scholar]
- Smerd, S. F. 1970, PASA, 1, 305 [Google Scholar]
- Smerd, S. F., Sheridan, K. V., & Stewart, R. T. 1974, Coronal Disturbances, 57, 389 [NASA ADS] [CrossRef] [Google Scholar]
- Vasanth, V. 2024, Sol. Phys., 299, 63 [Google Scholar]
- Vasanth, V., & Umapathy, S. 2013, Sol. Phys., 282, 239 [Google Scholar]
- Vasanth, V., Umapathy, S., Vrsnak, B., & Anna Lakshmi M. 2011, Sol. Phys., 273, 143 [Google Scholar]
- Vasanth, V., Umapathy, S., Vrsnak, B., et al. 2014, Sol. Phys., 289, 251 [NASA ADS] [CrossRef] [Google Scholar]
- Vršnak, B., Magdalenić, J., & Aurass, H. 2001, Sol. Phys., 202, 319 [Google Scholar]
- Weiss, A. A. 1963, Aus. J. Phys., 16, 240 [Google Scholar]
- Wild, J. P. 1950, Aus. J. Sci. Res. A Phys. Sci., 3, 399 [Google Scholar]
- Wild, J. P., & McCready, L. L. 1950, Australian J. Sci. Res. A Phys. Sci., 3, 387 [NASA ADS] [Google Scholar]
- Wild, J. P., & Smerd, S. F. 1972, ARA&A, 10, 159 [Google Scholar]
- Zhang, P., Morosan, D., Kumari, A., et al. 2024, A&A, 683, A123 [NASA ADS] [CrossRef] [EDP Sciences] [Google Scholar]
- Zimovets, I. V., & Sadykov, V. M. 2015, Adv. Space Res., 56, 2811 [NASA ADS] [CrossRef] [Google Scholar]
All Figures
|
Fig. 1. Dynamic spectrum of the high-frequency wide-band type-II burst recorded by the ORFEES radio spectrograph (670−144 MHz). The maximum brightness temperatures (TBmax) at different NRH frequencies are plotted with white lines. |
| In the text | |
|
Fig. 2. Eruptive structures observed by AIA in 94, 131, 171, and 211 Å running difference images. The dashed white line is the slit for the distance map shown in Fig. 4. The white arrow in the AIA 193 and 211 Å running difference images indicates the shock dip. A 3-second animation of this figure is available online. |
| In the text | |
|
Fig. 3. Top: Source active region observed on the solar limb in LASCO C2 images with possible CME–streamer interaction regions. Bottom: Eruptive structure on the day of the type-II burst in LASCO images. The radio sources are represented by the 50%, 70%, and 90% contours of the corresponding TBmax. |
| In the text | |
|
Fig. 4. Distance-time maps along the slice (plotted in Fig. 2) observed at AIA 94 and 211 Å. The velocities were determined via linear fittings to the distance-time profiles. |
| In the text | |
|
Fig. 5. Type-II radio sources observed by NRH at different frequencies at 12:03:41 UT. The radio sources are represented by the 80 %, 90 %, and 95 % contours of the corresponding TBmax. The last panel compares the various radio sources at different NRH channels observed at 12:03:41 UT. The red ellipse represents the beam shape at different NRH frequencies. The beam size is about ∼53 arcsecs at 408 MHz, ∼66 arcsecs at 327 MHz, ∼ 73 arcsecs at 298.7 MHz, ∼80 arcsecs at 270.6 MHz, ∼95 arcsecs at 228 MHz, ∼125 arcsecs at 173.2 MHz, and ∼144 arcsecs at 150.9 MHz along the major axis, and is about ∼39 arcsecs at 408 MHz, ∼49 arcsecs at 327 MHz, ∼53 arcsecs at 298.7 MHz, ∼59 arcsecs at 270.6 MHz, ∼70 arcsecs at 228 MHz, ∼92 arcsecs at 173.2 MHz, and ∼105 arcsecs at 150.9 MHz along the minor axis. A 22-second animation of this figure is available online. |
| In the text | |
|
Fig. 6. Temporal evolution of NRH radio sources superposed onto the closest-in-time AIA 211 Å images. The radio sources are represented by the 90% and 95% of the TBmax contours. A 16-second animation of this figure is available online. |
| In the text | |
|
Fig. 7. Sketch of the shock-loop system with the dip region and the corresponding type-II radio sources. |
| In the text | |
Current usage metrics show cumulative count of Article Views (full-text article views including HTML views, PDF and ePub downloads, according to the available data) and Abstracts Views on Vision4Press platform.
Data correspond to usage on the plateform after 2015. The current usage metrics is available 48-96 hours after online publication and is updated daily on week days.
Initial download of the metrics may take a while.